点击上方蓝字和“好玩的MATLAB”一起快乐玩耍吧!
2aiihgdyunq6403003606.jpg

好玩的matlab
带你解锁不一样的matlab新玩法
前面几篇推文详细的介绍了散点图和边际图的画法【MATLAB|回归曲线|置信区间|边际图|核密度填充图、MATLAB|聚类散点图|边际图|核密度填充图】,今天特意添加边际直方图的画法,喜欢此推文的小伙伴们记得点赞+关注+分享!【尊重作者劳动成果,转载请注明推文链接和公众号名】
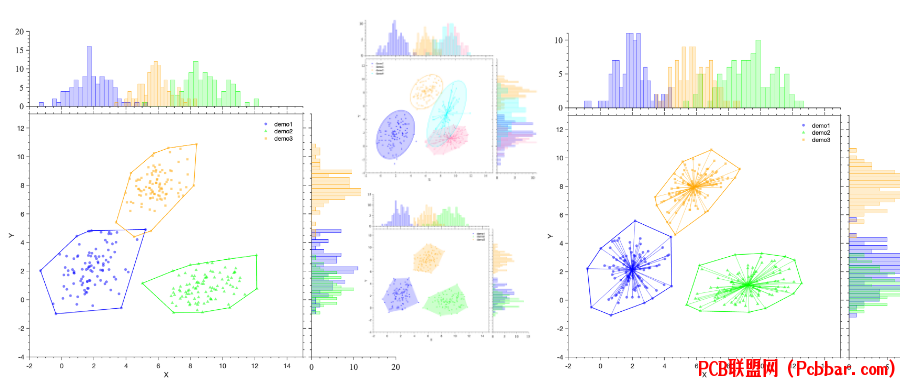
效果效果图图
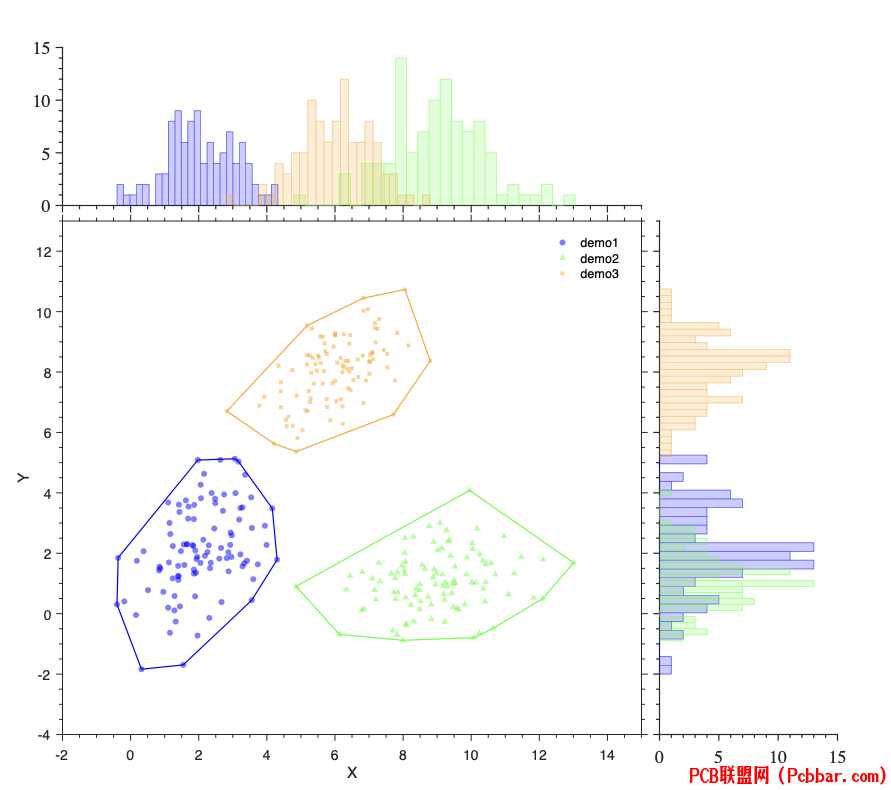
边际直方图效果图
bqzszlsvkpr6403003706.png

f4lae4sbzyk6403003806.gif

绘图工具函数classdef PlotDensHist %-------------------------------------------------------------------------- % @Author: 好玩的Matlab % @公众号:好玩的Matlab % @Created: 09,06,2023 % @Email:2377389590@qq.com % 尊重劳动成果,转载请备注推文链接和公众号名。 % @Disclaimer: This code is provided as-is without any warranty. %-------------------------------------------------------------------------- properties XData; % x数据 YData; % y数据 FillColor; % 填充颜色 FaceAlpha; % 透明度数 HFig; % 图形句柄 end methods function obj = PlotDensHist(sHdl) % 设置默认参数 obj.XData = get(sHdl, 'XData'); obj.YData = get(sHdl, 'YData'); obj.FillColor = get(sHdl, 'CData'); obj.FaceAlpha = get(sHdl, 'MarkerFaceAlpha') * 0.4;
obj.HFig = gcf; end function plotDensHist(obj) hFig = obj.HFig; % 获取当前figure的句柄 axesPositions = {[0.07, 0.07, 0.65, 0.65],... % 主图 [0.07, 0.07, 0.65, 0.65],... % 与主图重合 [0.07, 0.74, 0.65, 0.2],... % 顶部区域 [0.74, 0.07, 0.2, 0.65]}; % 右侧区域 axObj = findall(hFig, 'Type', 'axes'); hFig.Position = [439 76 891 790]; axesCount = length(axObj); if axesCount == 1 ax = gca; ax.Box = 'on'; ax.Position = axesPositions{1}; topAxes = axes('position', axesPositions{3}); rightAxes = axes('position', axesPositions{4}); end % 遍历所有 Axes 对象 for i = 1:length(axObj) ax = axObj(i); % 获取当前 Axes 对象 pos = get(ax, 'Position'); % 获取当前 Axes 对象的 Position 属性
% 检查 Position 是否匹配 if sum(abs(pos - axesPositions{1})) 1e-6 mainAxes = ax; elseif sum(abs(pos - axesPositions{3})) 1e-6 topAxes = ax; elseif sum(abs(pos - axesPositions{4})) 1e-6 rightAxes = ax; end end xi = obj.XData; yi = obj.YData; nbins = round(length(xi) / 4); % 这里绘制到topAxes if ~isempty(topAxes) axes(topAxes); hold on; histogram(topAxes, xi, nbins, 'FaceColor', obj.FillColor, ... 'EdgeColor', obj.FillColor, 'FaceAlpha', obj.FaceAlpha, 'LineWidth', 0.5) topAxes.YDir = 'normal'; topAxes.XMinorTick = 'on'; topAxes.YMinorTick = 'on'; topAxes.TickDir = 'out'; topAxes.TickLength = [.011 .01]; topAxes.XTickLabel = {}; topAxes.Visible = 'on'; topAxes.Box = 'off'; topAxes.LineWidth = 1.2; topAxes.FontSize = 18; topAxes.FontName = 'Times New Roman'; topAxes.XLim = ax.XLim; topAxes.Box = 'off'; end
% 这里绘制到rightAxes if ~isempty(rightAxes) axes(rightAxes); hold on; histogram(rightAxes, yi, nbins, 'FaceColor', obj.FillColor, 'Orientation', 'horizontal', ... 'EdgeColor', obj.FillColor, 'FaceAlpha', obj.FaceAlpha, 'LineWidth', 0.5) rightAxes.YDir = 'normal'; rightAxes.XMinorTick = 'on'; rightAxes.YMinorTick = 'on'; rightAxes.TickDir = 'out'; rightAxes.TickLength = [.011 .01]; rightAxes.YTickLabel = {}; rightAxes.Visible = 'on'; rightAxes.Box = 'off'; rightAxes.LineWidth = 1.2; rightAxes.FontSize = 18; rightAxes.FontName = 'Times New Roman'; rightAxes.XLim = topAxes.YLim; rightAxes.YLim = ax.YLim; rightAxes.Box = 'off'; end % 绑定X Y linkaxes([mainAxes, rightAxes], 'y') linkaxes([mainAxes, topAxes], 'x') end endend这个函数定义了PlotDensHist的MATLAB类,用于创建一个带有附加边际分布信息的直方图图形。以下是对该函数的分析和介绍:类属性:
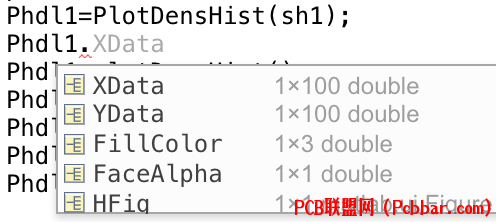
XData:存储主图中的X轴数据。
YData:存储主图中的Y轴数据。
FillColor:存储直方图的填充颜色。
FaceAlpha:存储填充区域的透明度。
HFig:存储图形句柄。
r25nanmc03x6403003906.png

根据句柄的形式调用。
构造函数 PlotDensHist(sHdl):
该构造函数接受一个图形句柄 sHdl 作为输入参数,并从该图形句柄中提取相关属性值,以初始化对象的属性。这些属性包括X轴数据、Y轴数据、填充颜色、线条颜色等。
构造函数将这些属性存储在对象的属性中,并设置默认的绘图参数。
plotDensHist 方法:
plotDensHist 方法用于在MATLAB图形中创建直方图,并添加附加的边际分布信息。
该方法首先获取当前图形的句柄 hFig,然后创建主图、顶部区域和右侧区域的坐标轴位置。
主图的数据来自对象的属性 XData 和 YData,并根据对象的其他属性(如填充颜色、线条颜色等)来绘制直方图。
顶部和右侧区域分别用于绘制边际分布的直方图,使用的数据分别是 XData 和 YData。
方法还设置了坐标轴的各种属性,如刻度线样式、字体大小等。
最后,通过 linkaxes 方法将主图和边际分布区域的坐标轴连接在一起,以确保它们在缩放时保持一致。
[/ol]案例clc;clear;close all;d1=repmat([2 2],100,1) + randn(100,2)*[1 .5; 0 1.32];d2=repmat([9 1],100,1) + randn(100,2)*[1.4 0.2; 0 0.98];d3=repmat([6 8],100,1) + randn(100,2)*[1 0.5; 0 1];
% 使用scatter函数绘制散点图hold onsh1=scatter(d1(:,1), d1(:,2),'filled','CData',[0,0,1],'MarkerFaceAlpha',0.5,'MarkerEdgeColor','none','Marker','o');sh2=scatter(d2(:,1), d2(:,2),'filled','CData',[0,1,0],'MarkerFaceAlpha',0.5,'MarkerEdgeColor','none','Marker','^');sh3=scatter(d3(:,1), d3(:,2),'filled','CData',[1,0.6471,0],'MarkerFaceAlpha',0.5,'MarkerEdgeColor','none','Marker','s');
% 画出凸包k1 = convhull(d1(:,1), d1(:,2));k2 = convhull(d2(:,1), d2(:,2));k3 = convhull(d3(:,1), d3(:,2));line(d1(k1,1), d1(k1,2), 'Color', [0 0 1],'LineWidth',1.2)line(d2(k2,1), d2(k2,2), 'Color', [0,1,0],'LineWidth',1.2)line(d3(k3,1), d3(k3,2), 'Color', [1,0.6471,0],'LineWidth',1.2)legend('demo1','demo2','demo3','box','off','Location','best')% 设置标签和标题ax=gca;box onax.XLim=[-2,15];ax.YLim=[-4,13];ax.XLabel.String='X';ax.YLabel.String='Y';ax.Title.String='';
ax.GridLineStyle = '-.'; % 设置网格线样式为虚线ax.GridColor = 'k'; % 设置网格线颜色为红色ax.XGrid = 'off'; % 关闭X网格线ax.YGrid = 'off'; % 打开Y网格线
ax.LineWidth = 1; % 设置坐标线宽ax.XMinorTick = 'on'; % 打开x次要刻度线ax.YMinorTick = 'on'; % 打开y次要刻度线ax.TickDir = 'out'; % 设置刻度线方向向外ax.FontSize = 14; % 设置坐标字体大小
Phdl1=PlotDensHist(sh1);Phdl1.plotDensHist();Phdl2=PlotDensHist(sh2);Phdl2.plotDensHist();Phdl3=PlotDensHist(sh3);Phdl3.plotDensHist();
gil2ybecvcz6403004006.png

- -THE END- -
源码下载:gitee下载:https://gitee.com/iDMatlab/cool-scatter-chart
vm5jihjpdrq6403004107.png

参考资料:
【1】MATLAB|炫酷的聚类散点图【2】MATLAB|聚类散点图|边际图|核密度填充图【3】MATLAB|回归曲线|置信区间|边际图|核密度填充图
zgqmb5md3on6403004207.gif

oq4ly2d2gno6403004307.png

送书活动
beuc4otendf6403004407.png

bf1bhclec4d6403004507.gif

包邮赠送 「北京大学出版社」赞助《MATLAB科学计算从入门到精通》
本书从 MATLAB 基础语法讲起,介绍了基于 MATLAB 函数的科学计算问题求解方法,实现了大量科学计算算法。
本书分为三大部分。第 1 章和第 2 章为 MATLAB 的基础知识,对全书用到的 MATLAB 基础进行了简单介绍。第 3 ~ 12 章为本书的核心部分,包括线性方程组求解、非线性方程求解、数值优化、数据插值、数据拟合与回归分析、数值积分、常微分方程求解、偏微分方程求解、概率统计计算及图像处理与信号处理等内容。第 13 ~ 15 章为实战部分,以实际生活中的数学问题为例,将前文介绍的各类科学计算算法应用其中。本书内容全面、通俗易懂,适合有一定 MATLAB 基础、想要进行进阶学习的读者。
了解更多
▼▼▼
3nk2gzxw2rm6403004607.jpg

【抽奖方式及满足条件】:
1.关注「好玩的MATLAB 」公众号和视频号
cffsd5fjw5q6403004707.jpg

2.给本文点【赞】+【在看】;
3.留言区评论点赞最多的前3名。
4.本活动只针对从未获过奖的同学,之前获过奖的小伙伴,不用参加。
同时满足上述4个条件的读者朋友,包邮赠送一本
【开奖时间】:2023年10月10日夜晚8点
【领奖方式】:在开奖时加小编私人微信:idmatlab
扫一扫加管理员微信
on3q2tatior6403004807.png

gx15pxjc5gt6403004907.jpg

|