|
|
点击上方蓝字和“好玩的MATLAB”一起快乐玩耍吧!; Y# n$ p' h; y5 T0 C* S
5hiwmtkxfce6405188421.jpg
 + t$ }8 l3 J, n+ v, r
好玩的matlab+ z- ^/ r6 g4 l$ j$ W- ^) @& _6 k
带你解锁不一样的matlab新玩法
5 z/ V1 N5 D! K4 J# U5 c P
9 A& f- ^6 c! R' `+ O# F$ M之前小编写MATLAB|一张图搞定绘图配色问题的时候遇到颜色排序的问题,我特意查阅一些文献和算法准备详细的介绍一下关于颜色排序的方法,喜欢此推文的小伙伴们记得点赞+关注+分享!【尊重作者劳动成果,转载请注明推文链接和公众号名】2 i( H5 Y9 L2 s: R+ V7 y( B+ p
4 i! x6 k' l$ V2 f$ ]
4gneg1znyue6405188521.jpg
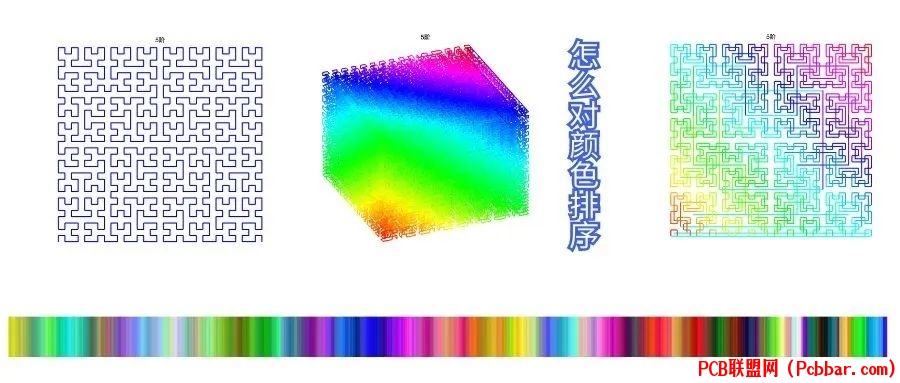
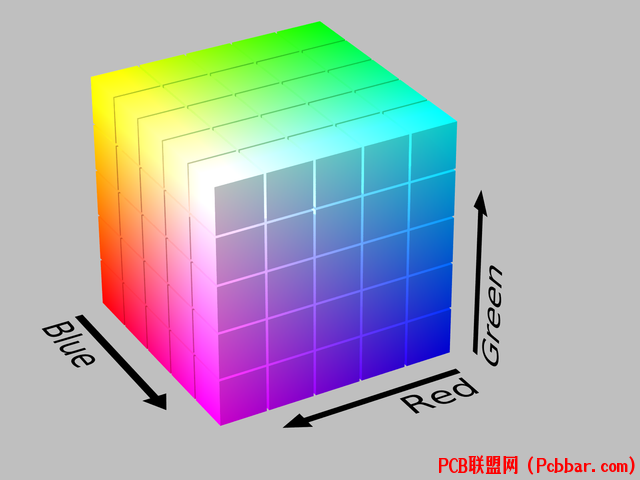
, c0 n6 f& i. V. }* _之前推文留下一个问题,就是怎么对颜色进行排序的问题。现实中没有一种通用的方法可以准确地对颜色列表进行排序。每种颜色都可以映射到三维空间中的一个向量。换句话说,每种颜色都由三个独特的数值定义。在计算机科学领域,存在多种竞争性的模型来表示这个颜色空间。其中最为熟知的是红-绿-蓝(RGB)颜色空间,这是一个立方体模型,将每种颜色分解为红色、绿色和蓝色的成分。
$ q k0 Y- [0 [( ?0 S) i
u4bfqshi14x6405188621.png
 : L9 ^. M7 A$ I
另一种在计算机科学中常见的颜色模型是色调(相)-饱和度-值(HSV)空间。该空间将颜色映射到一个圆柱体上,突出显示每种颜色的不同特征。有时候,这些特征比RGB描述更具有帮助性。
. V& T7 n3 z8 R/ }因此,当面对一组不同的颜色时,没有一种单一的方法可以对它们进行排序。我们可以根据它们的颜色通道、色调、或者饱和度和亮度的某种组合来排序。然而,人类最为熟悉的颜色排序方式是按照自然界彩虹??出现的颜色顺序来排列。这相当于按照颜色的色调进行排序。9 h1 w$ h" K( }
3m3zdxjq2tw6405188722.png
 3 k; P2 G2 e2 g! K ^* \3 z! P8 N7 p
下面将详细介绍一些颜色排序算法:1、按照不同颜色通道排序;2、色相、饱和度值、灰度值排序;3、Hilbert算法排序;4、旅行商算法排序;5、遗传算法排序。首先考虑最简单的按照不同的 RGB颜色通道排序,先创建一堆随机颜色,并对RGB每个通道进行排序绘图。clc;clear;close all;%--------------------------------------------------------------------------% @Author: 好玩的Matlab && 猪猪% @公众号:好玩的Matlab% @Created: 09,18,2023% @Email: 2377389590@qq.com% 尊重劳动成果,转载请备注推文链接和公众号名,严禁商用。%--------------------------------------------------------------------------numColors = 1000;%随机生成颜色colors = rand(numColors,3);I = repmat(1:size(colors, 1), 1000, 1);figure('name','随机颜色','Position', [465 499 800 65])imagesc(I)ax = gca;ax.Visible = 'off';colormap(colors);% 基于红色通道排序sortedColorsRed = sortrows([colors, (1:numColors)'], 1,'descend');figure('name','红色通道排序','Position', [465 499 800 65])imagesc(I)ax = gca;ax.Visible = 'off';colormap(sortedColorsRed(:, 1:3));% 基于绿色通道排序sortedColorsGreen = sortrows([colors, (1:numColors)'], 2,'descend');figure('name','绿色通道排序','Position', [465 499 800 65])imagesc(I)ax = gca;ax.Visible = 'off';colormap(sortedColorsGreen(:, 1:3));% 基于蓝色通道排序sortedColorsBlue = sortrows([colors, (1:numColors)'], 3,'descend');figure('name','蓝色通道排序','Position', [465 499 800 65])imagesc(I)ax = gca;ax.Visible = 'off';colormap(sortedColorsBlue(:, 1:3));disp(char([20844 20247 21495 58 22909 29609 30340 77 97 116 108 97 98]))随机颜色$ [2 ^9 x5 J# Y0 m- l. N
xmscb5k1pkk6405188822.png

& j; O! R; G) q: Y+ ~# N+ TR通道descend排序
8 n1 `% J5 p8 w3 |+ F
03qpkrsd1ml6405188922.png
 + _0 J3 `+ ]6 b) h
G通道descend排序
% l$ o" f# q1 O. z; }% {- T
5ywhmclwcqw6405189022.png

, G' x/ J$ b: x/ R2 xB通道descend排序4 L/ J6 B( Z: T! p' R, c2 d1 i
m4wd34t2gi56405189122.png

# |: X* F& ~5 @$ M& O" b+ N Z换成另外一种2D表现形式
1 d6 N0 } v& rclc;clear;close all;%--------------------------------------------------------------------------% @Author: 好玩的Matlab && 猪猪% @公众号:好玩的Matlab% @Created: 09,18,2023% @Email: 2377389590@qq.com% 尊重劳动成果,转载请备注推文链接和公众号名,严禁商用。%--------------------------------------------------------------------------% 创建一个300x300的三通道(RGB)图像oriImg = zeros(300, 300, 3, 'uint8');% 使用循环为图像的每个像素随机生成颜色for i = 1:300 for j = 1:300 oriImg(i, j, :) = uint8([randi([0, 255]), randi([0, 255]), randi([0, 255])]); endendfigure('Position',[492 121 509 482])% 创建一个1x4的subplot布局,用于显示多张图像subplot(2, 2, 1);imshow(oriImg);title('Random Colors');% 按照红色通道排序sortedImageRed = oriImg;for i = 1:300 sortedImageRed(i, :, 1) = sort(oriImg(i, :, 1));endsubplot(2, 2, 2);imshow(sortedImageRed);title('Sorted by Red Channel');% 按照绿色通道排序sortedImageGreen = oriImg;for i = 1:300 sortedImageGreen(i, :, 2) = sort(oriImg(i, :, 2));endsubplot(2, 2, 3);imshow(sortedImageGreen);title('Sorted by Green Channel')% 按照蓝色通道排序sortedImageBlue = oriImg;for i = 1:300 sortedImageBlue(i, :, 3) = sort(oriImg(i, :, 3));endsubplot(2, 2, 4);imshow(sortedImageBlue);title('Sorted by Blue Channel');disp(char([20844 20247 21495 58 22909 29609 30340 77 97 116 108 97 98]))3 C. J1 N4 O1 G3 r& k
p4zvivjo4v46405189222.png
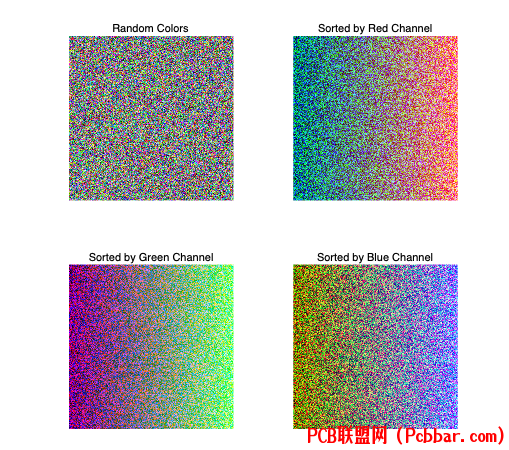
1 X3 }+ e' F! C9 [很容易发现按通道值排序的颜色过度特别明显,排序的效果特别差,所以颜色通道排序方式不考虑在内。相反,如果我们将图像转换为 HSV,我们就会得到一个几乎有意义的排序值。3 Y) V$ n# d( x
xpwxuxtfzwv6405189323.png
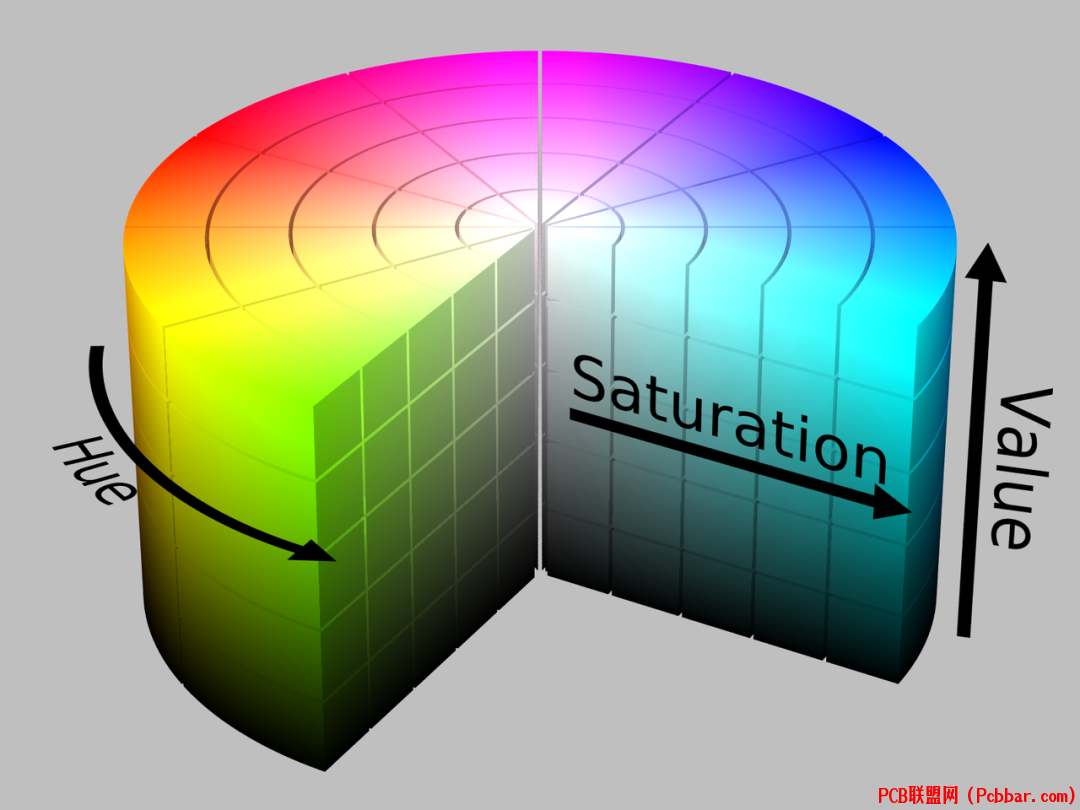
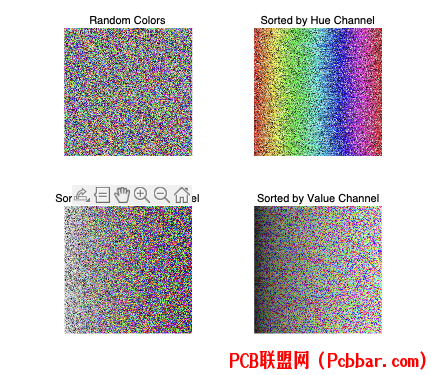
( g5 A7 F8 M) D9 i" ]! T: F这是因为 HSV 中的色调形成了一个圆圈。意味着如果在色相维度上进行线性排序,就会得到一个线性的、美观的图。只需在色相中保持一致的饱和度和值,就会得到彩虹排序。clc;clear;close all;%--------------------------------------------------------------------------% @Author: 好玩的Matlab && 猪猪% @公众号:好玩的Matlab% @Created: 09,18,2023% @Email: 2377389590@qq.com% 尊重劳动成果,转载请备注推文链接和公众号名,严禁商用。%--------------------------------------------------------------------------% 创建一个300x300的三通道(RGB)图像oriImg = zeros(300, 300, 3, 'uint8');% 使用循环为图像的每个像素随机生成颜色for i = 1:300 for j = 1:300 oriImg(i, j, :) = uint8([randi([0, 255]), randi([0, 255]), randi([0, 255])]); endend% 创建一个1x4的subplot布局,用于显示多张图像figure('Position',[492 228 431 375]);subplot(2, 2, 1);imshow(oriImg);title('Random Colors');% 将RGB图像转换为HSV颜色空间hsvImg = rgb2hsv(double(oriImg) / 255);% 按照H(色相)通道排序sortedHue = hsvImg;for i = 1:300 sortedHue(i, :, 1) = sort(hsvImg(i, :, 1));end% 恢复为0-1范围并转回RGB颜色空间sortedHue = hsv2rgb(sortedHue);sortedHue = uint8(sortedHue*255);subplot(2, 2, 2);imshow(sortedHue);title('Sorted by Hue Channel');%按照S(饱和度)通道排序sortedSat = hsvImg;for i = 1:300 sortedSat(i, :, 2) = sort(hsvImg(i, :, 2));end%恢复为0-1范围并转回RGB颜色空间sortedSat = hsv2rgb(sortedSat);sortedSat = uint8(sortedSat*255);subplot(2, 2, 3);imshow(sortedSat);title('Sorted by Saturation Channel');%按照V(亮度)通道排序sortedVal = hsvImg;for i = 1:300 sortedVal(i, :, 3) = sort(hsvImg(i, :, 3));end%恢复为0-1范围并转回RGB颜色空间sortedVal = hsv2rgb(sortedVal);sortedVal = uint8(sortedVal * 255);subplot(2, 2, 4);imshow(sortedVal);title('Sorted by Value Channel');disp(char([20844 20247 21495 58 22909 29609 30340 77 97 116 108 97 98])), ^% Y% q/ ]' M
cb0phgji1vq6405189423.png
 " h% M! j% Z" Z- u- @$ B
很容易看出按照色相排序可以得到最接近彩虹??的颜色。
3 F1 {9 g7 V: _( K, B; X+ D. c6 _虽然RGB色彩空间在显示器上表现色彩亮丽,但它并不能有效地表示颜色之间的相似性。为解决这一问题,HSV色彩空间引入了一个名为'Hue'的参数。色调表示颜色的基本色调,它通过饱和度的变化而增强或减弱。第三个参数,通常称为'Value'(值),则决定了颜色的明亮度。由于色调按照彩虹的方式排列,直接根据HSV值排序有时可以产生视觉上更连贯的效果。5 m9 m2 X; \1 j$ R/ o
clc;clear;close all;%--------------------------------------------------------------------------% @Author: 好玩的Matlab && 猪猪% @公众号:好玩的Matlab% @Created: 09,18,2023% @Email: 2377389590@qq.com% 尊重劳动成果,转载请备注推文链接和公众号名,严禁商用。%--------------------------------------------------------------------------numColors = 1000;colors = rand(numColors,3);I = repmat(1:size(colors, 1), 1000, 1);figure('name','随机颜色','Position', [465 499 800 65])imagesc(I)ax = gca;ax.Visible = 'off';colormap(colors);% 基于HSV色相通道排序colorsHSV = rgb2hsv(colors);sortedColorsHSV = sortrows([colors, colorsHSV(:, 1), (1:numColors)'], 4,'descend');figure('name','HSV色相通道排序','Position', [465 499 800 65]);imagesc(I);ax = gca;ax.Visible = 'off';colormap(sortedColorsHSV(:, 1:3));% 基于HLS色相通道排序(自定义方法)colorsHLS = rgb2hsv(colors);HLSValues = zeros(numColors, 1);for i = 1:numColors HLSValues(i) = rgb2hls_custom(colorsHLS(i, :));endsortedColorsHLS = sortrows([colors, HLSValues, (1:numColors)'], 4,'descend');figure('name','HLS色相通道排序','Position', [465 499 800 65]);imagesc(I);ax = gca;ax.Visible = 'off';colormap(sortedColorsHLS(:, 1:3));disp(char([20844 20247 21495 58 22909 29609 30340 77 97 116 108 97 98]))% 自定义函数计算HLS色相function hlsValue = rgb2hls_custom(rgbValue) r = rgbValue(1); g = rgbValue(2); b = rgbValue(3); maxColor = max([r, g, b]); minColor = min([r, g, b]); delta = maxColor - minColor; l = (maxColor + minColor) / 2; if delta == 0 h = 0; s = 0; else if l s = delta / (maxColor + minColor); else s = delta / (2 - maxColor - minColor); end if maxColor == r h = (g - b) / delta + (g elseif maxColor == g h = (b - r) / delta + 2; else h = (r - g) / delta + 4; end h = h / 6; end hlsValue = h;endHSV空间随机颜色排序
$ S0 s; F; G0 @9 u! @# A+ F
mipowg2arby6405189523.png
 2 |$ K6 Z& e/ s4 R3 w# K' E
HSV空间对灰度颜色排序
$ ]$ Y* J% s. G- D; x* G: \
fdcekr52ao26405189623.png

! R' ~% o; v" R3 O/ xHLS空间随机颜色排序2 L- ?( U' N& P) S2 i# d/ @2 A
41wffipytdy6405189723.png

$ i/ p+ @6 d% c, ], `+ f4 ]. ZHLS空间对灰度颜色排序8 K$ F0 j6 @+ n0 P7 _" f! U$ k
if022xdmkgj6405189823.png
 1 L( j. w1 J8 L1 L% F* G; L% p0 ~
这两种排序方案整体看起来颜色过度剧烈,但是对于灰度颜色排序HSV和HLS还有所不同。
7 @' [$ c) ?8 F4 uHSV空间考虑了色调和感知亮度,在视觉上比较了具有相似强度的两种不同颜色接近;HLS空间比较两种不同深浅的颜色更接近。为了弥补这缺点,尝试直接根据颜色的感知亮度进行排序。
" p, |' W2 O7 ?" c7 E& Mclc;clear;close all;%--------------------------------------------------------------------------% @Author: 好玩的Matlab && 猪猪% @公众号:好玩的Matlab% @Created: 09,18,2023% @Email: 2377389590@qq.com% 尊重劳动成果,转载请备注推文链接和公众号名,严禁商用。%--------------------------------------------------------------------------numColors= 1000;colors = rand(numColors,3);I = repmat(1:size(colors, 1), 1000, 1);% 自定义亮度函数lum = @(r, g, b) sqrt(0.241 * r + 0.691 * g + 0.068 * b);% 计算亮度并添加到颜色矩阵中luminance = arrayfun(@(i) lum(colors(i, 1), colors(i, 2), colors(i, 3)), 1:numColors)';colorsWithLum = [colors, luminance];% 按照亮度排序sortedColorsLum = sortrows(colorsWithLum, 4,"ascend");figure('name','按照亮度排序','Position', [465 499 800 65])imagesc(I)ax = gca;ax.Visible = 'off';colormap(sortedColorsLum(:, 1:3));disp(char([20844 20247 21495 58 22909 29609 30340 77 97 116 108 97 98]))对随机颜色排序+ K- `' _7 B! L- j3 ?/ m! \' u a; c
pwixrnarhje6405189923.png

. F( ]$ f/ K: J; j: W7 y% f/ M0 W; A对灰度颜色排序
3 ]7 o: z7 V6 {. |1 w2 t
cztaxtp2yox6405190023.png
 $ I! L1 ]" ~+ I# L. q% N
很容易看出对 RGB颜色亮度排序非常差,但是对灰度颜色排序非常好。3 B3 J. {+ X0 {; K, b
合并色调和亮度信息以获得更平滑的结果,为了减轻排序对第一个分量的影响,可以将颜色空间从 0 到 1 之间的浮点值减小到 0 到 30之间的整数。通过这样做,可以消除大部分噪声。7 h- Q J0 |, p. ?2 g/ r& u
clc;clear;close all;%--------------------------------------------------------------------------% @作者:好玩的Matlab && 猪猪% @公众号:好玩的Matlab% @创建日期:09,18,2023% @邮箱:2377389590@qq.com% @尊重劳动成果,转载请备注推文链接和公众号名,严禁商用。%--------------------------------------------------------------------------% 生成随机颜色numColors = 1000;colors = rand(numColors,3);% 生成颜色索引indices = repmat(1:size(colors, 1), 1000, 1);% 定义重复次数和步长repetitions = 30;steps = zeros(numColors, 3);% 计算每个颜色的步长for i = 1:numColors rgb = colors(i, :); hsv = rgb2hsv(rgb); h1 = int32(hsv(1) * repetitions); % 计算色调步长 lum = int32(sqrt(0.241 * rgb(1) + 0.691 * rgb(2) + 0.068 * rgb(3)) * repetitions); % 计算亮度步长 % 计算饱和度步长 v2 = int32(hsv(3) * repetitions); steps(i, :) = [h1, lum, v2];endcolorsWithSteps = [colors, steps];% 将颜色和步长合并sortedColorsSteps = sortrows(colorsWithSteps, [4, 5, 6], 'ascend');% 按步长对颜色进行排序figure('Position', [465 499 800 65])% 创建图像窗口并绘制颜色索引imagesc(indices)ax = gca;ax.Visible = 'off';colormap(sortedColorsSteps(:, 1:3));% 设置颜色映射disp(char([20844 20247 21495 58 22909 29609 30340 77 97 116 108 97 98]))对随机颜色排序
* ^, V0 t$ f- \
jl0nnsggyeg6405190123.png
 ; i) x" L: z5 I$ a6 F6 k
对灰度颜色排序- u& j. A8 F3 c: z+ M# l% N
4bgkaxfcmlm6405190224.png

6 }: z; j- t2 X) }0 e9 d! x1 U大部分噪声并未被消除,但这些片段看起来不再连续。为了解决这个问题,可以反转所有其他部分的亮度。' P/ c/ |7 Q9 o; P7 |5 z* S) V
clc; clear; close all; % 关闭所有图形窗口%--------------------------------------------------------------------------% @Author: 好玩的Matlab && 猪猪% @公众号:好玩的Matlab% @Created: 09,18,2023% @Email: 2377389590@qq.com% 尊重劳动成果,转载请备注推文链接和公众号名,严禁商用。%--------------------------------------------------------------------------numColors = 1000; % 颜色数量colors = rand(numColors,3);% colors=bone(numColors);indices = repmat(1:size(colors, 1), 1000, 1); % 创建颜色索引矩阵repetitions = 30; % 重复次数steps = zeros(numColors, 3); % 创建一个存储步骤的矩阵% 遍历颜色for i = 1:numColors rgb = colors(i, :); hsv = rgb2hsv(rgb); % 转换为HSV颜色空间 h1 = int32(hsv(1) * repetitions); lum = int32(sqrt(0.241 * rgb(1) + 0.691 * rgb(2) + 0.068 * rgb(3)) * repetitions); % 计算亮度 v = int32(hsv(3) * repetitions); % 如果h1是奇数,反转v2和lum if mod(h1, 2) == 1 v = repetitions - v; lum = repetitions - lum; end steps(i, :) = [h1, lum, v];endcolorsWithSteps = [colors, steps]; % 将颜色和步骤合并sortedColorsSteps = sortrows(colorsWithSteps, [4, 5, 6], 'descend'); % 根据步骤排序颜色figure('Position', [465 499 800 65]) % 创建一个图形窗口imagesc(indices) % 在图形窗口中绘制颜色ax = gca; % 获取当前坐标轴ax.Visible = 'off'; % 隐藏坐标轴colormap(sortedColorsSteps(:, 1:3)); % 设置颜色映射disp(char([20844 20247 21495 58 22909 29609 30340 77 97 116 108 97 98]))对随机颜色排序
; v- u9 t/ {; H: z
2amsnod3jwi6405190324.png
 , l$ C' ^/ {* I, L
对灰度颜色排序
: q0 z. a n( ~$ b
* r- x" E" D" F& \" h' L现在看起来大多是连续的,与原HSV排序相比噪音非常小。
5 X# p- V: c+ X$ |4 I还有另一种对颜色进行排序的方法,基于希尔伯特曲线的概念。可以将希尔伯特曲线想象为使用一维曲线映射 2D 空间中每个点的方法。' A7 j' b1 {: Q& T
 % R/ s2 q! n! r8 @. o& T7 R4 ^" M0 Q % R/ s2 q! n! r8 @. o& T7 R4 ^" M0 Q
希尔伯特排序(Hilbert Sort)是一种多维数据排序方法,它通过将多维数据点映射到希尔伯特曲线上的一维序列,然后对这个一维序列进行排序。
; Y* X; E) v' }6 j
6 ]" f/ r" H- y: F: Q. \, ^3 I; J希尔伯特曲线是一种空间填充曲线,具有连续性和局部性的特点,使得在曲线上相邻的点在多维空间中也是接近的。$ q$ B0 a) I/ c( H1 p
下图是希尔伯特排序 1 到 3 阶的过程:3 X* E6 u: L' i" W" @3 Y
3 f! E- |% l1 u p3 j
 " a, i4 @& \- \0 h/ n, s2 D7 N& H " a, i4 @& \- \0 h/ n, s2 D7 N& H
| 9 H2 g( {# o$ V$ t- z$ ^ ^% u

4 l: S/ m% j/ z* W7 P2 u6 T |
( S3 U: F( o# `: T3 g! k/ V
1 {6 j0 v5 p) V. M7 l |
用matlab 实现2D希尔伯特排序 1 到 7 阶的过程:
- |9 I) e- \% pclc; clear; close all; %--------------------------------------------------------------------------% @Author: 好玩的Matlab && 猪猪% @公众号:好玩的Matlab% @Created: 09,18,2023% @Email: 2377389590@qq.com% 尊重劳动成果,转载请备注推文链接和公众号名,严禁商用。%--------------------------------------------------------------------------num = 7; % 阶数figure('Position', [476 400 521 472]) % 创建图形窗口hold ondefaultAxesgifFile = 'hilbert2_c.gif'; % GIF文件名for i = 1:num [x, y] = hilbert(i); % 调用hilbert函数生成曲线坐标 colors = abs(x + 0.5) + abs(y + 0.5); % 根据坐标计算颜色 p = patch(x, y, colors, 'edgecolor', 'flat', 'facecolor', 'none', 'linewidth', 2); % 绘制Hilbert曲线的填充区域 colormap(hsv(length(x))) title([num2str(i), '阶']) % 设置标题 legName{i} = [num2str(i), '阶']; % 设置图例项名称 drawnow pause(1) frame = getframe(gcf); im = frame2im(frame); [A, map] = rgb2ind(im, 256); if i == 1 imwrite(A, map, gifFile, 'gif', 'LoopCount', Inf, 'DelayTime', 1); % 创建GIF文件 else imwrite(A, map, gifFile, 'gif', 'WriteMode', 'append', 'DelayTime', 1); % 添加帧到GIF文件 end p.Visible = 'off';enddisp(char([20844 20247 21495 58 22909 29609 30340 77 97 116 108 97 98])) function [x,y] = hilbert(n)% Example% [x,y]=hilbert(5);plot(x,y)if n0 x=0; y=0;else [xo,yo]=hilbert(n-1); x=.5*[-.5+yo -.5+xo .5+xo .5-yo]; y=.5*[-.5+xo .5+yo .5+yo -.5-xo];endend
6 c$ H$ _9 F# }/ R7 I # v* I' t; A; M, N: @ # v* I' t; A; M, N: @
|
/ h2 h, ^" I: [( l& T5 x- U* y& | % h. R, ~, m1 { % h. R, ~, m1 {
|
matlab实现3D的希尔伯特排序 1到 5阶:clc;clear;close all;%--------------------------------------------------------------------------% @Author: 好玩的Matlab && 猪猪% @公众号:好玩的Matlab% @Created: 09,18,2023% @Email: 2377389590@qq.com% 尊重劳动成果,转载请备注推文链接和公众号名,严禁商用。%--------------------------------------------------------------------------num = 5; % 阶数figure('Position', [476 400 521 472]) % 创建3D图形窗口defaultAxesview(3) % 设置视角为3DgifFile = 'hilbert3D.gif'; % GIF文件名for i = 1:num [x, y, z] = hilbert3(i); % 调用hilbert3函数生成曲线坐标 colors = x + y + z; % 根据坐标计算颜色 patch(x, y, z, colors, 'edgecolor', 'flat', 'facecolor', 'none', 'linewidth', 2) % 绘制Hilbert曲线的填充区域 colormap(hsv(length(z))) title([num2str(i), '阶']) % 设置标题 legName{i} = [num2str(i), '阶']; % 设置图例项名称 drawnow pause(1) frame = getframe(gcf); im = frame2im(frame); [A, map] = rgb2ind(im, 256); if i == 1 imwrite(A, map, gifFile, 'gif', 'LoopCount', Inf, 'DelayTime', 1); % 创建GIF文件 else imwrite(A, map, gifFile, 'gif', 'WriteMode', 'append', 'DelayTime', 1); % 添加帧到GIF文件 endenddisp(char([20844 20247 21495 58 22909 29609 30340 77 97 116 108 97 98]))function [x,y,z] = hilbert3(n)% Hilbert 3D curve.% Example: plot the 3-rd order curve% [x,y,z] = hilbert3(3); plot3(x,y,z)if nargin ~= 1 n = 2;endif n 0 x = 0; y = 0; z = 0;else [xo,yo,zo] = hilbert3(n-1); x = .5*[.5+zo .5+yo -.5+yo -.5-xo -.5-xo -.5-yo .5-yo .5+zo]; y = .5*[.5+xo .5+zo .5+zo .5+yo -.5+yo -.5-zo -.5-zo -.5-xo]; z = .5*[.5+yo -.5+xo -.5+xo .5-zo .5-zo -.5+xo -.5+xo .5-yo];endend
- O) n: Y/ E6 J+ e: K7 T 5 j8 v* {+ h! D! M+ x 5 j8 v* {+ h! D! M+ x
希尔伯特排序的主要特点包括:空间填充曲线:希尔伯特曲线是一种空间填充曲线,意味着它能够通过连续、无重叠的路径来覆盖整个多维空间(在这种情况下是二维或三维空间)。局部性保持:希尔伯特曲线有一个非常重要的属性,就是它保持了空间局部性,也就是说,空间上相邻的点在曲线上的映射也会是相邻的或接近的,这有助于提高数据检索和访问的效率。多维数据排序和组织:它常用于多维数据的排序和组织,因为它可以很好地将多维空间映射到一维空间,同时保持数据的空间相邻性。平衡的分布:通过将数据点映射到希尔伯特曲线上,可以实现数据点在空间上的更均衡分布,有利于提高某些计算和数据处理任务的效率。希尔伯特排序算法将随机颜色映射到2D中1 P9 L4 R/ i# }8 P, \% b+ o6 @3 i

% I8 m* M; t% i t( s% u8 D希尔伯特排序算法将灰度颜色映射到2D中
5 B" v2 |3 W+ V/ L0 c* U : _: Q! I; F7 p; p+ K5 z% j : _: Q! I; F7 p; p+ K5 z% j
希尔伯特排序算法将随机颜色映射到3D中
Z& L, N9 J) v" C1 G) M' H& l" F
9 h# Q' J6 V/ b+ B希尔伯特排序算法将灰度颜色映射到3D中
1 U+ D9 V& {) x/ V0 _
! y3 P1 S) o3 D3 E4 I0 w很容易看出,尽管两种希尔伯特排序算法没有遵循任何直观的颜色分布,但局部看起来非常均匀。虽然上述所有技术都可以正确地对灰度颜色进行排序,但希尔伯特排序以一种非常不同的方式重新排列。接着我尝试着旅行商算法# K. F" O: c S3 W4 I
旅行商问题涉及一个非常实际的问题:访问一定数量的城市,使总距离最小化,并且每个城市只访问一次。这听起来正是我们想要的:只访问每种颜色一次,使总距离最小化。这是一种花哨的方式来表述该问题,在计算上代价太高,无法在数千种颜色上运行。我们可以通过将颜色空间视为一个图,其中每个颜色是一个节点,并计算每对颜色之间的“距离”,然后使用旅行商算法来找到访问所有颜色的最短路径。(https://en.wikipedia.org/wiki/NP-completeness)
T" n9 e$ t8 z8 ^7 A e) r; U下面给出一个旅行商简化版的算法案例:clc; clear; close all;%--------------------------------------------------------------------------% @Author: 好玩的Matlab && 猪猪% @公众号:好玩的Matlab% @Created: 09,18,2023% @Email: 2377389590@qq.com% 尊重劳动成果,转载请备注推文链接和公众号名,严禁商用。%--------------------------------------------------------------------------numPts = 10;gifFile = 'travExp.gif';dataPts = randi([10, 90], [numPts, 2]);x = dataPts(:, 1);y = dataPts(:, 2);ax = gca;ax.Box = 'on';ax.Color = [1, 1, 1];ax.XLim = [0, 100];ax.YLim = [0, 100];ax.LineWidth = 1.5;ax.XGrid='on';ax.YGrid='on';ax.GridLineStyle = '--';ax.XLabel.String=char([20844 20247 21495 58 22909 29609 30340 77 97 116 108 97 98]);hold onplot(x, y, 'bs','MarkerSize',20,'MarkerFaceColor','b')pause(1);% 随机抽取一点selPt = randi([1, numPts]);currPt = selPt;visPts = currPt;disp(char([20844 20247 21495 58 22909 29609 30340 77 97 116 108 97 98]))for iter = 1:numPts-1 minDist = inf; nextPt = currPt; lineHdls = []; for i = 1:numPts if ismember(i, visPts) continue; end dist = sqrt((x(i) - x(currPt))^2 + (y(i) - y(currPt))^2); lineHdl = plot([x(currPt), x(i)], [y(currPt), y(i)], '-gs','linewidth',2, ... 'MarkerFaceColor','b','MarkerEdgeColor','g','MarkerSize',20); lineHdls = [lineHdls, lineHdl]; drawnow pause(0.2); % 下面是保存 gif的代码 frame = getframe(gcf); im = frame2im(frame); [A, map] = rgb2ind(im, 256); if iter == 1 imwrite(A, map, gifFile, 'gif', 'LoopCount', Inf, 'DelayTime', 0.2); else imwrite(A, map, gifFile, 'gif', 'WriteMode', 'append', 'DelayTime', 0.2); end if dist minDist = dist; nextPt = i; end end % 删除不是最短的路径线的图 for i = 1:length(lineHdls) delete(lineHdls(i)); end % 绘制最短路径的图 plot([x(currPt), x(nextPt)], [y(currPt), y(nextPt)], '-rs', 'LineWidth', 2,'MarkerSize',20,'MarkerFaceColor','b'); fprintf('Current minimum distance: %.2f
) B- c; d5 _, P* f', minDist); pause(0.5); visPts = [visPts, nextPt]; currPt = nextPt;enddisp(char([20844 20247 21495 58 22909 29609 30340 77 97 116 108 97 98]))hold off
/ k) D) [1 O+ |' ]& o3 M! c
" a2 G" G, z8 [旅行商算法对颜色排序clc; clear; close all;%--------------------------------------------------------------------------% @Author: 好玩的Matlab && 猪猪% @公众号:好玩的Matlab% @Created: 09,18,2023% @Email: 2377389590@qq.com% 尊重劳动成果,转载请备注推文链接和公众号名,严禁商用。%--------------------------------------------------------------------------numColors = 1000; % 定义要生成的颜色数量% 用随机数生成器生成每种颜色的RGB值colors = rand(numColors, 3); % colors=bone(numColors);% 计算颜色之间的距离矩阵colorDistances = zeros(numColors, numColors);for i = 1:numColors for j = i:numColors dist = sqrt(sum((colors(i,:) - colors(j,:)).^2)); colorDistances(i, j) = dist; colorDistances(j, i) = dist; % 距离矩阵是对称的 endend% 旅行商算法开始 - 这里我们使用一个简化的最近邻方法currentColor = randi(numColors); % 从一个随机颜色开始visitedColors = currentColor;remainingColors = setdiff(1:numColors, currentColor);for iter = 1:numColors-1 [~, nearestColorIdx] = min(colorDistances(currentColor, remainingColors)); nearestColor = remainingColors(nearestColorIdx); visitedColors = [visitedColors, nearestColor]; remainingColors = setdiff(remainingColors, nearestColor); currentColor = nearestColor;end% 现在 visitedColors 包含了按旅行商算法排序的颜色的索引sortedColors = colors(visitedColors, :);% 显示排序后的颜色indices = repmat(1:size(colors, 1), 1000, 1); figure('Position', [465 499 800 65]);imagesc(indices);ax = gca;ax.Visible = 'off';colormap(sortedColors(:, 1:3));disp(char([20844 20247 21495 58 22909 29609 30340 77 97 116 108 97 98]))旅行商算法对随机颜色排序. {, T2 ?/ _& [0 T
 ( }& L# O" i0 b: S n* \4 j ( }& L# O" i0 b: S n* \4 j
旅行商算法对灰度颜色排序4 s! j; g) i0 Q& `) G
+ u s/ ~# k/ O1 I& r

. H( u' j" f) v2 j, @( [很容易看出旅行商算法对颜色的排序特点:局部过度"自然柔和",对灰度排序有一处颜色“跳动”,但是整体灰度颜色过度“柔和平缓”。接着小编脑洞大开……旅行商都可以给颜色排序,那么?遗传算法可以吗?3 o$ G/ `4 j2 c C1 @
clc; clear; close all;%--------------------------------------------------------------------------% @Author: 好玩的Matlab && 猪猪% @公众号:好玩的Matlab% @Created: 09,18,2023% @Email: 2377389590@qq.com% 尊重劳动成果,转载请备注推文链接和公众号名,严禁商用。%--------------------------------------------------------------------------numColors = 200; % 定义颜色的数量colors = rand(numColors, 3); % 随机生成颜色% colors=bone(numColors);popSize = 200; % 种群大小numGen = 1000; % 迭代次数eliteCount = 2; % 精英个体数量mutationRate = 0.2; % 变异率% 初始化种群population = cell(popSize, 1);for i = 1:popSize population{i} = randperm(numColors);endfor gen = 1:numGen % 计算适应度 fitness = zeros(popSize, 1); for i = 1:popSize fitness(i) = calcFitness(colors, population{i}); end % 精英选择 [sortedFitness, sortedIndices] = sort(fitness); nextPopulation = population(sortedIndices(1:eliteCount)); % 保存当前代的最佳适应度 bestFitness(gen) = sortedFitness(1); % 交叉和变异 for i = eliteCount+1:popSize parent1 = population{sortedIndices(randi([1, eliteCount]))}; parent2 = population{sortedIndices(randi([1, eliteCount]))}; child = crossover(parent1, parent2); if rand child = mutate(child); end nextPopulation{end+1} = child; end % 更新种群 population = nextPopulation; % 显示当前最佳解决方案的适应度 disp(['Generation ', num2str(gen), ': ', num2str(sortedFitness(1))]);end% 绘制迭代收敛曲线figure;plot(1:numGen, bestFitness,'-b','LineWidth',2);xlabel('Generation');ylabel('Best Fitness');title('Convergence Curve');defaultAxes% 获取并显示最佳解决方案bestSolution = population{sortedIndices(1)};sortedColors = colors(bestSolution, :);figure('Position', [465 499 800 65])I=reshape(sortedColors, [1, numColors, 3]);imagesc(I)colormap(sortedColors);ax = gca;ax.Visible = 'off';disp(char([20844 20247 21495 58 22909 29609 30340 77 97 116 108 97 98]))
9 a0 k8 W( [* d7 Hfunction fitness = calcFitness(colors, order)sortColors = colors(order, :);dColors = diff(sortColors, 1, 1);dist = sqrt(sum(dColors.^2, 2));fitness = sum(dist);endfunction child = crossover(parent1, parent2)crossPoint = randi([1, length(parent1)-1]);child = [parent1(1:crossPoint), setdiff(parent2, parent1(1:crossPoint), 'stable')];endfunction individual = mutate(individual)swapIdx = randperm(length(individual), 2);individual(swapIdx) = flip(individual(swapIdx));end遗传算法对随机颜色排序
6 a3 H/ g7 G- `8 V0 r+ i8 A) Y) I
* Y$ p! b' V Q2 q0 s) z遗传算法对灰度颜色排序9 G$ W. f7 K4 ?' G0 w- |9 i! H) \# K+ V
 4 h- b7 D9 ~% T* h7 q 4 h- b7 D9 ~% T* h7 q
收敛曲线
. q/ R, y# g0 o. S
: e8 W7 P7 I( D此方法排序后的颜色过度也是非常“柔和”,对于少量颜色排序的情况下效果非常明显!遗传算法对随机10个颜色排序. @* K" C7 z9 j3 l% E2 `# M

8 {, @% i4 `) M8 }% _遗传算法对10个灰度级颜色排序
# }) ]* ^$ W1 O. l% p ]# H
; t* O. `4 Q$ H5 f5 X5 `4 |3 y6 j然后……, z/ j) w# L$ l5 v( L5 f
 $ B$ m6 |' m' _; Y $ B$ m6 |' m' _; Y
写不下去了,到此为止吧!想到一大堆各种种群优化算法,头大了!粒子群优化 (PSO)、蚁群优化算法 (ACO)、人工蜂群算法 (ABC)、兽群算法 (AHA)、鱼群算法 (FSA)、萤火虫算法 (FA)、果蝇优化算法 (FOA)灰狼优化算法 (GWO)、蝙蝠算法 (BA)、狼群算法 (WPA)、鸽群优化算法 (PIO)、猫群算法 (CSO)、蜻蜓算法 (DA)、鸟群算法 (BSA)、兔子群算法 (RHA)、蜂群算法 (HBA)……整个人都麻了!我不可能每一个智能算法都试试,下期见~溜了~- -THE END- -
5 z& @- q- l% |' l" Q+ W( |" {) m5 R& r' v/ N
源码下载:gitee下载:https://gitee.com/iDMatlab/color-sorting; ]9 r! _. u: B6 |. r& G
 2 {+ x8 |0 r: _' ^9 z+ Y 2 {+ x8 |0 r: _' ^9 z+ Y
参考资料:
7 q9 h2 |$ J) ~9 ~【1】http://rainbowsmoke.hu/home【2】https://jxmo.io/posts/color-sort【3】https://en.wikipedia.org/wiki/Hilbert_curve【4】https://en.wikipedia.org/wiki/NP-completeness【5】https://www.alanzucconi.com/2015/09/30/colour-sorting/【6】https://nbviewer.org/gist/CamDavidsonPilon/abe3f0e4f589f53c4128【7】https://uk.mathworks.com/matlabcentral/fileexchange/4646-hilbert-curve【8】https://blogs.mathworks.com/steve/2012/01/25/generating-hilbert-curves/【9】https://mathematica.stackexchange.com/questions/87588/how-to-sort-colors-properly【10】https://www.makeartwithpython.com/blog/visualizing-sort-algorithms-in-python/2 b0 {( h5 W4 j7 a/ |( y
 , E7 S3 T, A8 Z" d , E7 S3 T, A8 Z" d
 7 x S J# f4 W x' ^% I 7 x S J# f4 W x' ^% I
送书活动 w/ f0 P9 j8 N) I/ W5 T- z4 ^

. H/ b" b/ o$ n% @
9 n! s/ }$ x9 w( D" i: G; E* \. X. Q8 v: V
包邮赠送 「北京大学出版社」赞助《ANSYS Workbench项目分析与案例实操详解》
* A' g! v6 e! D. }本书以ANSYS Workbench 2022 R2为基础,一共讲解了17个案例,依次为电动机转子离心力强度分析、光伏跟踪支架模态分析、轮胎接触分析、发电机风扇过盈配合分析、螺栓预紧力仿真计算、球头弹塑性仿真计算、弹簧板的线性屈曲分析、转子临界转速计算、光伏跟踪支架檩条强度分析、电动机铁心谐响应分析、矿用机架地震响应谱分析、光缆部件温度场分析、二维齿轮动态分析、CT 机架预应力模态分析、曲轴连杆刚体动力学分析、方形框架起吊强度分析和轴柄疲劳仿真计算。
0 r: M' E9 ?2 n; `) }6 P本书工程背景深厚,内容丰富,适用于机械、航空航天、材料、能源等专业的本科生、研究生和工程技术人员。通过本书的案例讲解,读者能够熟练掌握ANSYS Workbench 2022 R2软件的实用操作,同时也能理解软件在工程应用中发挥的重大作用。
$ b6 R H. l( _3 f' v了解更多
. J7 a1 x; m4 b- ]. `* F▼▼▼
4 F# S; W5 {' g$ V4 k ]+ U. j ) |( `1 Y8 d- ]8 F7 { ) |( `1 Y8 d- ]8 F7 {
【抽奖方式及满足条件】:
8 [) B' u/ ?8 D1.关注「好玩的MATLAB 」公众号和视频号
. g9 V/ w2 w1 ~# b: D . w6 y7 V7 _2 ]( V+ L . w6 y7 V7 _2 ]( V+ L
2.给本文点【赞】+【在看】;: D* r! O! g' j! h2 \9 w' m+ F
3.留言区评论点赞最多的前3名。
3 r9 q+ }& u7 T同时满足上述3个条件的读者朋友,包邮赠送一本:《ANSYS Workbench项目分析与案例实操详解》& m% A. n: t0 s1 H% H
【开奖时间】:2023年9月20日夜晚8点( S# S$ b/ T9 [5 f( P
【领奖方式】:在开奖时加小编私人微信:idmatlab p# R, W2 J8 I
扫一扫加管理员微信
4 a1 R- l9 ]3 d/ J " k/ q$ N3 ~" ~2 a3 ^# `- h: }) [ " k/ q$ N3 ~" ~2 a3 ^# `- h: }) [
 |
|