|
|
点击上方蓝字和“好玩的MATLAB”一起快乐玩耍吧!) n0 T( ^* `1 P8 j& c! r
uvhgyjbvxj36405194538.jpg
 " K5 v7 V4 y) e4 P" h
好玩的matlab' C$ l+ y* q/ M6 X2 I
带你解锁不一样的matlab新玩法* [, k6 h W% n. Q! B, n5 e
, U! Z* \6 ^( [8 P
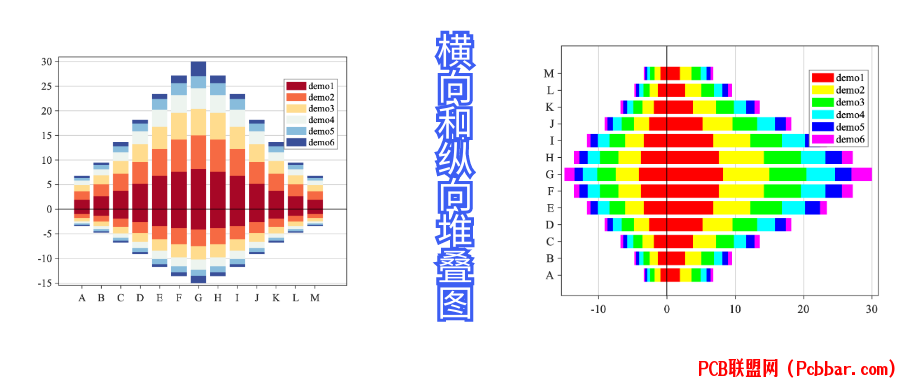
今天偶然看见"某号"推文关于绘制横向纵向的堆叠图,小编觉得很漂亮,但是不提供源码,接着发现要付费 300¥,哎!作为社会主义接班人,崇尚开源精神的小编,没有条件就创造条件,这么简单的图,那我就自己复现一个源码吧~,喜欢此推文的小伙伴们记得点赞+关注+分享!【尊重作者劳动成果,转载请注明推文链接和公众号名】
2 n% O O$ I# y6 V3 f) Q1 A; O9 g( H( D7 F! p7 ~" e% }1 h- R0 Q
xliineu20sl6405194638.png
 ; I& e$ t- n) z' {( v' z8 y; m
效果图5 d5 |) V# m; e" H
42v405lk33v6405194739.png
' P5 D+ P1 F: r0 ]6 x5 y# E8 C7 ~5 \1 n d+ ^( z/ X* a
txi0mq3exji6405194839.gif
 2 q& j# K K- }2 R* l
& ^$ I+ _) E1 Q基本代码复现纵向图, ] b. r6 o- B1 |
bkbevquddlt6405194939.png

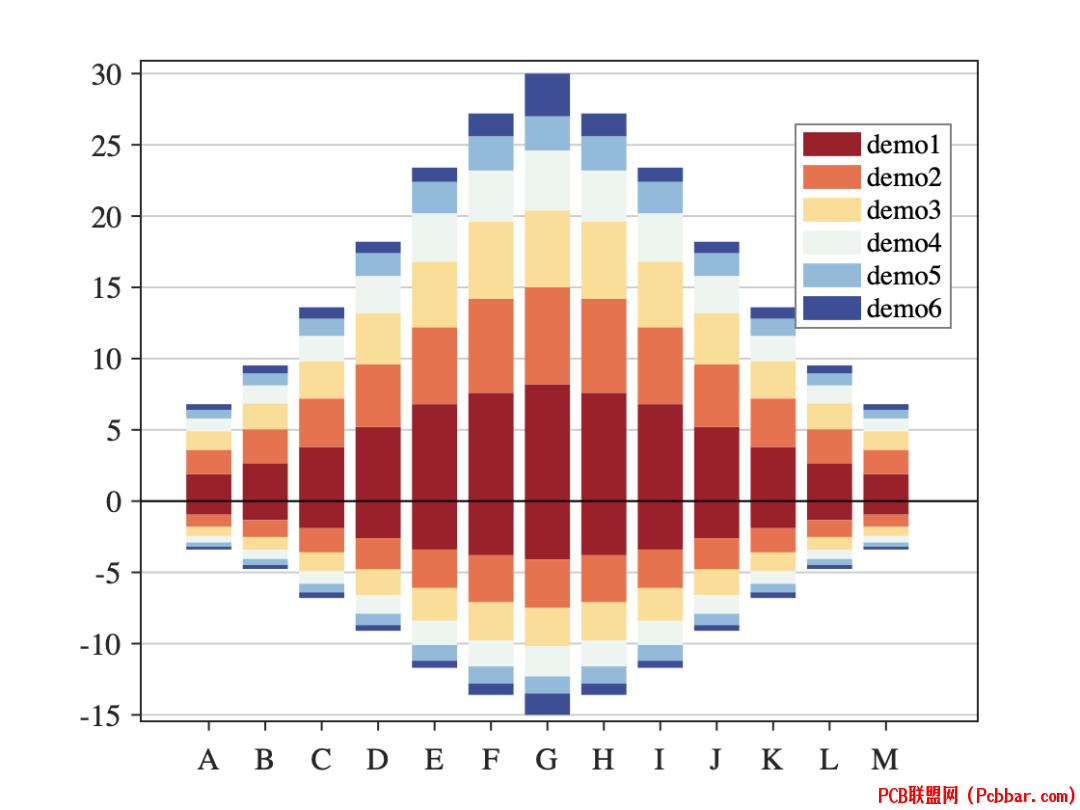
/ [9 Y& y- q% j% 清除命令行、清除工作空间和关闭所有图形clc; clear; close all;%--------------------------------------------------------------------------% @Author: 好玩的Matlab% @公众号:好玩的Matlab% @Created: 09,10,2023% @Email: 2377389590@qq.com% @【尊重作者劳动成果,转载请注明推文链接和公众号名】% @Disclaimer: This code is provided as-is without any warranty.%--------------------------------------------------------------------------% 定义各个柱状条的颜色colors = [ 0.656, 0.0280, 0.148; 0.964, 0.416, 0.264; 1.000, 0.864, 0.556; 0.928, 0.956, 0.936; 0.532, 0.736, 0.864; 0.224, 0.308, 0.600];% 定义正数部分数据posX = [1.90 1.70 1.30 0.9 0.6 0.4; 2.66 2.38 1.82 1.26 0.84 0.560; 3.80 3.40 2.60 1.80 1.20 0.8; 5.20 4.40 3.60 2.60 1.60 0.8; 6.80 5.40 4.60 3.40 2.20 1; 7.60 6.60 5.40 3.60 2.40 1.6; 8.20 6.80 5.40 4.20 2.40 3; 7.60 6.60 5.40 3.60 2.40 1.6; 6.80 5.40 4.60 3.40 2.20 1; 5.20 4.40 3.60 2.60 1.60 0.8; 3.80 3.40 2.60 1.80 1.20 0.8; 2.66 2.38 1.82 1.26 0.840 0.56; 1.90 1.70 1.30 0.9 0.6 0.4];% 定义负数部分数据(正数部分的-0.5倍)negX = posX * -0.5;% 获取数据的维度[rows, cols] = size(posX);% 创建图形figure;hold on;% 绘制正数部分的柱状图posB = bar(posX, 'stacked', 'EdgeColor', 'none');% 为每个正数柱状条设置颜色for i = 1:numel(posB) posB(i).FaceColor = colors(i, :);end% 绘制负数部分的柱状图negB = bar(negX, 'stacked', 'EdgeColor', 'none');% 为每个负数柱状条设置颜色for i = 1:numel(negB) negB(i).FaceColor = colors(i, :);end% 添加图例legName = {'demo1', 'demo2', 'demo3', 'demo4', 'demo5', 'demo6'};lg = legend(legName, 'Location', 'best', 'EdgeColor', [1, 1, 1] * 0.5);% 设置坐标轴标签tickNames = {'A', 'B', 'C', 'D', 'E', 'F', 'G', 'H', 'I', 'J', 'K', 'L', 'M'};defaultAxes('ver', tickNames);% 清除图例的最后一项(如果有需要)lg.String(end) = [];
. P; L* s% g$ O( {3 D! Y: ]; E
rsbsvyfabqy6405195039.png
 3 {9 p0 k0 ?/ Y) M
?
2 N0 z/ i9 S* t: |; [( @5 u/ U3 j3 B5 @
基本代码复现横向图: G4 A/ z; C$ u, t
$ A8 A4 {* J+ o/ x7 f M8 q* G$ Bclc;clear;close all;%--------------------------------------------------------------------------% @Author: 好玩的Matlab% @公众号:好玩的Matlab% @Created: 09,10,2023% @Email:2377389590@qq.com% @【尊重作者劳动成果,转载请注明推文链接和公众号名】% @Disclaimer: This code is provided as-is without any warranty.%--------------------------------------------------------------------------
; v# C1 x& i0 X/ d% 颜色定义colors = hsv(6);% 定义数据posX = [1.90 1.70 1.30 0.9 0.6 0.4; 2.66 2.38 1.82 1.26 0.84 0.560; 3.80 3.40 2.60 1.80 1.20 0.8; 5.20 4.40 3.60 2.60 1.60 0.8; 6.80 5.40 4.60 3.40 2.20 1; 7.60 6.60 5.40 3.60 2.40 1.6; 8.20 6.80 5.40 4.20 2.40 3; 7.60 6.60 5.40 3.60 2.40 1.6; 6.80 5.40 4.60 3.40 2.20 1; 5.20 4.40 3.60 2.60 1.60 0.8; 3.80 3.40 2.60 1.80 1.20 0.8; 2.66 2.38 1.82 1.26 0.840 0.56; 1.90 1.70 1.30 0.9 0.6 0.4]; % 正数部分negX = -0.5 * posX; % 负数部分% 获取数据的维度[rows, cols] = size(posX);% 创建图形figure;hold on;% 画正数部分的条形图posB = barh(posX, 'stacked', 'EdgeColor', 'none');% 设置正数部分的颜色for i = 1:cols posB(i).FaceColor = colors(i, :);end% 画负数部分的条形图negB = barh(negX, 'stacked', 'EdgeColor', 'none');% 设置负数部分的颜色for i = 1:cols negB(i).FaceColor = colors(i, :);endlegName={'demo1', 'demo2','demo3','demo4','demo5','demo6'};lg=legend(legName,'Location','best','EdgeColor',[1,1,1]*0.5);tickNames={'A', 'B','C','D','E','F','G','H','I','J','K','L','M'};defaultAxes('hor',tickNames)lg.String(end) = [];
& I% O: }/ g M8 O% d3 O, u
fcmqncyklj56405195139.png
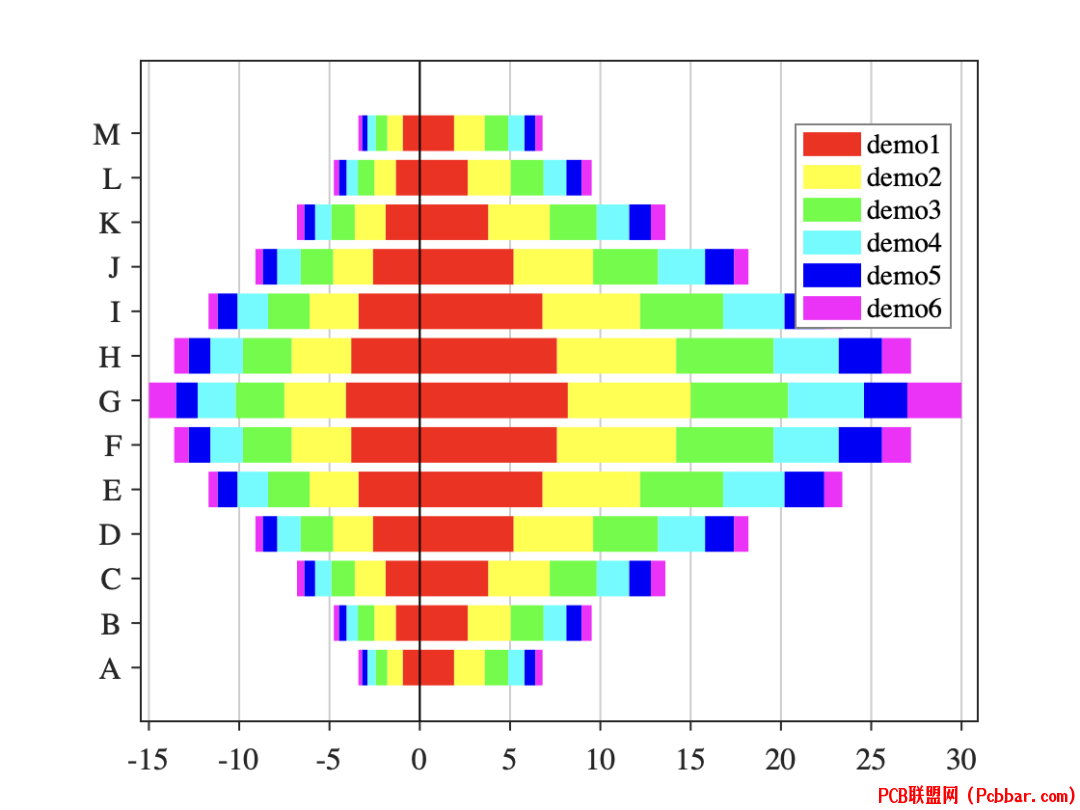
! P) a" E9 w8 r' C* F其中defaultAxes是图片修饰代码如下:function defaultAxes(type, tickNames)%--------------------------------------------------------------------------% @Author: 好玩的Matlab% @公众号:好玩的Matlab% @Created: 09,10,2023% @Email: 2377389590@qq.com% @【尊重作者劳动成果,转载请注明推文链接和公众号名】% @Disclaimer: This code is provided as-is without any warranty.%-------------------------------------------------------------------------- % 获取当前的坐标轴 ax = gca;* U: a' U0 M' `5 N0 t
% 基本坐标轴设置 ax.Box = 'off'; ax.Color = [1, 1, 1]; % 背景颜色设置为白色 ax.LineWidth = 1; % 坐标轴线宽度 ax.FontSize = 16; % 坐标轴字体大小 ax.FontName = 'Times New Roman'; % 设置字体类型
; F- R- s4 B% Y i % 网格线设置 ax.GridLineStyle = '-'; % 主网格线样式 ax.GridColor = 'k'; % 主网格线颜色(黑色) ax.GridAlpha = 0.2; % 主网格线透明度 ax.MinorGridLineStyle = '-'; % 次网格线样式 ax.MinorGridColor = [0 0 0]; % 次网格线颜色(黑色) ax.MinorGridAlpha = 0.3; % 次网格线透明度
7 V, L, [2 Q4 L @. H % 刻度设置 ax.XMinorTick = 'off'; % x轴次刻度关闭 ax.YMinorTick = 'off'; % y轴次刻度关闭 ax.TickDir = 'out'; % 刻度线方向向外
2 M! u5 W! O6 x+ p % 调整坐标轴范围 ax.XLim = [min(ax.XLim) * 1.03, max(ax.XLim) * 1.03]; ax.YLim = [min(ax.YLim) * 1.03, max(ax.YLim) * 1.03];1 B. N4 G$ V5 O. L5 M; C0 u! `
% 根据图的类型(纵向或横向)进行不同设置 if strcmp(type, 'ver') ax.XGrid = 'off'; ax.YGrid = 'on'; ax.XTick = 1:length(tickNames); ax.XTickLabel = tickNames; line([xlim], [0 0], 'Color', 'k', 'LineWidth', 1); elseif strcmp(type, 'hor') ax.XGrid = 'on'; ax.YGrid = 'off'; ax.YTick = 1:length(tickNames); ax.YTickLabel = tickNames; line([0 0], [ylim], 'Color', 'k', 'LineWidth', 1); else error('Invalid orientation. Choose either "ver" or "hor".'); end
2 z9 ?7 z5 k9 B! N, K$ p % 添加额外的坐标轴(右侧和顶部) axur = axes('Units', ax.Units, ... 'Position', ax.Position, ... 'XAxisLocation', 'top', ... 'YAxisLocation', 'right', ... 'Color', 'none', ... 'XColor', ax.XColor, ... 'YColor', ax.YColor);/ ?- V7 c* T% W% g* ?
axur.LineWidth = 1; axur.XTick = []; axur.YTick = [];end觉得这两种绘图方式还是不够简洁,于是我撸了一个绘制纵向和横向的堆叠图调用的类函数StackedBarPlotter。
* I% q5 Q' J3 S* N0 n2 i7 l+ W: CStackedBarPlotter类函数
0 N- T8 t! m4 ?6 X4 N
# ]: p# X. l' A3 Yclassdef StackedBarPlotter %-------------------------------------------------------------------------- % @Author: 好玩的Matlab % @公众号:好玩的Matlab % @Created: 09,10,2023 % @Email:2377389590@qq.com % @【尊重作者劳动成果,转载请注明推文链接和公众号名】 % @Disclaimer: This code is provided as-is without any warranty. %--------------------------------------------------------------------------8 w* y6 F! S1 N" D
properties PosX % 正数部分数据 NegX % 负数部分数据 Colors % 柱状图颜色 TickNames % 坐标轴标签名称 Type % 图的方向(纵向或横向) end, {+ m" L( t# D! ~) X8 k# @
methods % 构造函数 function obj = StackedBarPlotter(varargin) % 获取默认参数值 defValues = obj.getDefaultValues();% f( r/ y4 A* ^4 ?
% 解析输入参数 p = obj.parseInput(defValues, varargin{:});, o. w/ i ~* _ b2 _ C* Z
% 从解析结果中设置对象属性 obj.PosX = p.Results.PosX; obj.NegX = p.Results.NegX; obj.Colors = p.Results.Colors; obj.TickNames = p.Results.TickNames; obj.Type = p.Results.Type; end# F0 d, b% }0 |% {
% 绘图函数 function plot(obj) [rows, cols] = size(obj.PosX); hold on; if strcmp(obj.Type, 'ver') % 使用 bar 绘制纵向图 poxB = bar(obj.PosX, 'stacked', 'EdgeColor', 'none'); negB = bar(obj.NegX, 'stacked','EdgeColor','none'); elseif strcmp(obj.Type, 'hor') % 使用 barh 绘制横向图 poxB = barh(obj.PosX, 'stacked', 'EdgeColor', 'none'); negB = barh(obj.NegX, 'stacked','EdgeColor','none'); set(gca, 'YTick', 1:rows, 'YTickLabel', obj.TickNames); else error('Invalid orientation. Choose either "vertical" or "horizontal".'); end % 设置颜色 for i = 1:cols poxB(i).FaceColor = obj.Colors(i, :); negB(i).FaceColor = obj.Colors(i, :); end end end
9 k8 Y; a _# C! x( j methods (Access = private) % 获取默认值的私有方法 function defValues = getDefaultValues(~) % 在这里定义默认值 defValues = struct('PosX', [], 'NegX', [], 'Colors', [], 'TickNames', {}, 'Type', 'ver'); end0 U0 } c- Q* W
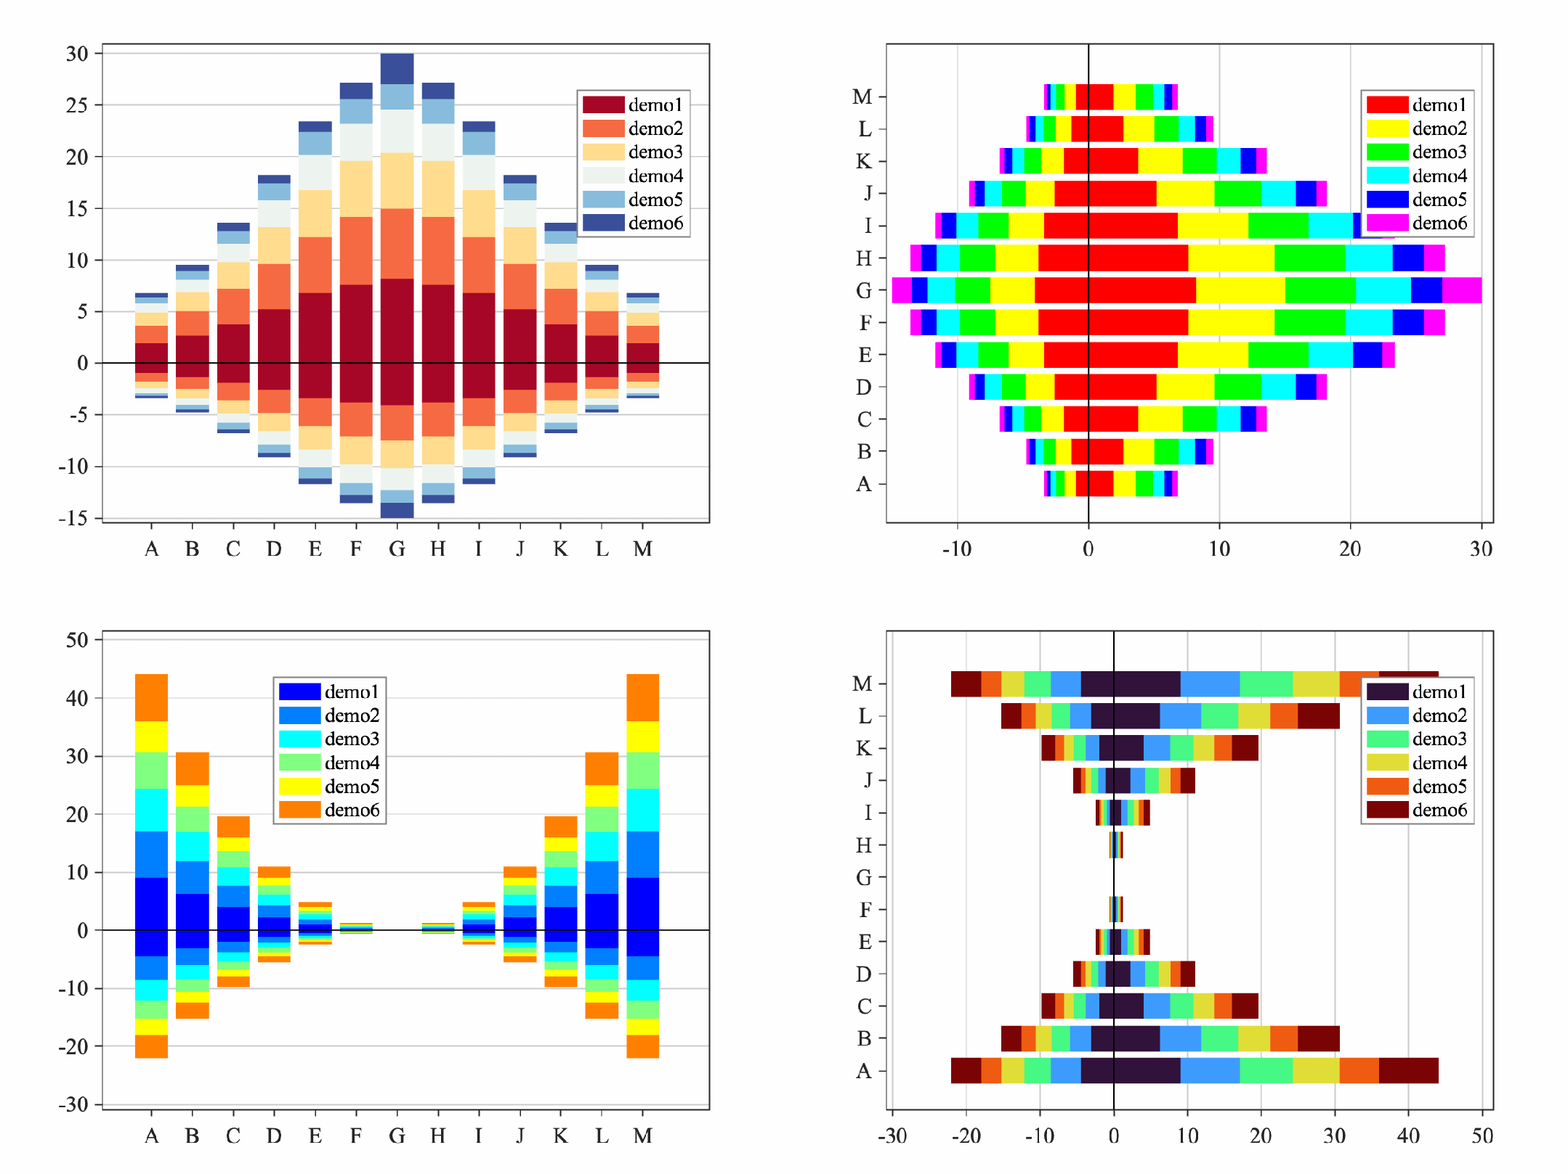
% 解析输入参数的私有方法 function p = parseInput(~, defValues, varargin) p = inputParser; p.CaseSensitive = false; % 添加参数、默认值和验证函数 addParameter(p, 'PosX', defValues.PosX, @isnumeric); addParameter(p, 'NegX', defValues.NegX, @isnumeric); addParameter(p, 'Colors', defValues.Colors, @isnumeric); addParameter(p, 'TickNames', defValues.TickNames, @iscellstr); addParameter(p, 'Type', defValues.Type, @(x) any(validatestring(x, {'ver', 'hor'}))); % 解析输入参数 parse(p, varargin{:}); end endend这个Matlab类StackedBarPlotter是用于生成堆积柱状图的。具体地,它包括以下功能:属性(properties)PosX: 正数部分数据,用于绘制图中的正向柱。NegX: 负数部分数据,用于绘制图中的负向柱。Colors: 柱状图的颜色。TickNames: 坐标轴标签名称。Type: 图的方向,可以是纵向('ver')或横向('hor')。方法(methods)构造函数(Constructor): 当创建一个StackedBarPlotter对象时,这个构造函数会被调用。它接受多个参数,如PosX, NegX, Colors等,并设置这些作为对象属性。plot方法: 这个方法用于绘制图像。它根据Type属性(纵向或横向)来选择使用Matlab的bar函数还是barh函数。私有方法(methods with Access = private)getDefaultValues: 返回一个包含默认值的结构体。这些默认值用于初始化对象属性。parseInput: 这个方法用于解析传入构造函数的参数。它使用Matlab的inputParser来验证参数并设置它们。工作流程当你创建一个StackedBarPlotter对象时,构造函数会被调用,它会解析输入参数并设置对象的属性。之后,你可以调用plot方法来绘制堆积柱状图。
; J) C s/ R+ b3 A, R调用方式3 H8 ?) l" l1 E) b( Q; d5 ~
% H9 ?! q( ]4 y( z; b5 Q% 清除命令行、清除工作空间和关闭所有图形clc; clear; close all;
8 Y) i. j8 O. c9 p/ N' k- X4 i%--------------------------------------------------------------------------% @Author: 好玩的Matlab% @公众号:好玩的Matlab% @Created: 09,10,2023% @Email: 2377389590@qq.com% @【尊重作者劳动成果,转载请注明推文链接和公众号名】% @Disclaimer: This code is provided as-is without any warranty.%--------------------------------------------------------------------------
8 p! @: H) ~. f! S: s8 ~% 定义正数部分数据和颜色6 W! k3 ?" H' i8 M
colors = jet(6);x=[linspace(-3,3,13)].^2;posX =[x;x*0.9;x*0.8;x*0.7;x*0.6;x*0.9]';negX = posX * -0.5; % 定义负数部分数据(正数部分的-0.5倍)% 定义坐标轴标签ticknames = {'A', 'B', 'C', 'D', 'E', 'F', 'G', 'H', 'I', 'J', 'K', 'L', 'M'};% 创建第一个图形(纵向)figure;subplot(1,2,1)plotterVer = StackedBarPlotter('posX', posX, 'negX', negX, 'colors', colors, 'TickNames', ticknames, 'type', 'ver');plotterVer.plot();% 添加图例legName = {'demo1', 'demo2', 'demo3', 'demo4', 'demo5', 'demo6'};lg = legend(legName, 'Location', 'best', 'EdgeColor', [1, 1, 1] * 0.5);defaultAxes('ver', ticknames);lg.String(end) = [];
# T \9 J. P) l/ b% 创建第二个图形(横向)subplot(1,2,2)colors = turbo(6);plotterHor = StackedBarPlotter('posX', posX, 'negX', negX, 'colors', colors, 'TickNames', ticknames, 'type', 'hor');plotterHor.plot();% 添加图例legName = {'demo1', 'demo2', 'demo3', 'demo4', 'demo5', 'demo6'};lg = legend(legName, 'Location', 'best', 'EdgeColor', [1, 1, 1] * 0.5);defaultAxes('hor', ticknames);lg.String(end) = [];
( D: _5 Q, x7 ]
l11nnraj1sj6405195240.png
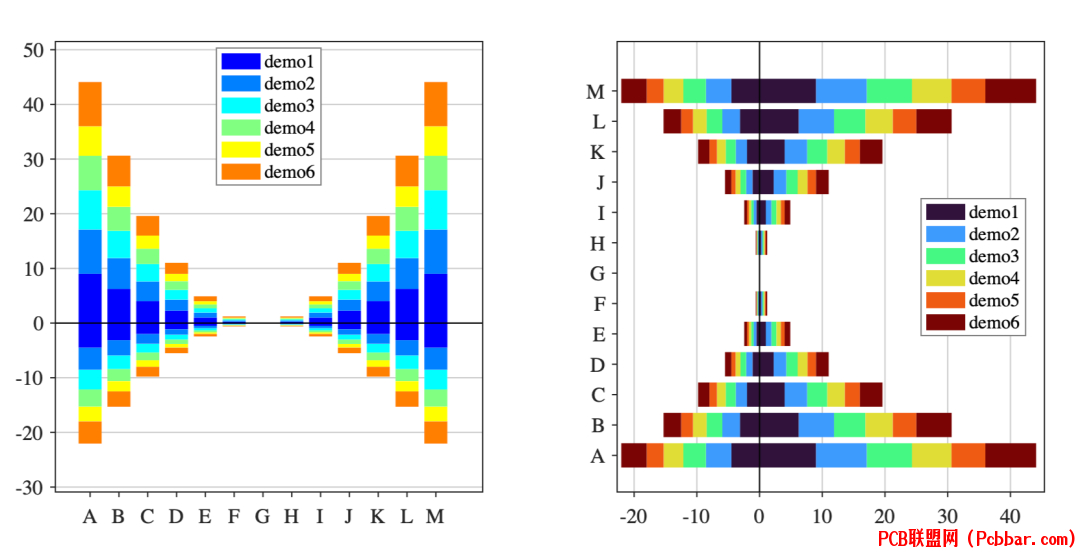 , c( {6 n2 k) ]9 B& [6 B* V8 F5 A
5 `; K3 S2 d2 ?2 ^- -THE END- -
; G" [4 {7 h: Y! o/ r" c; t7 X% s8 D% O/ _
源码下载:gitee下载:https://gitee.com/iDMatlab/StackedBarPlotter8 u/ Y0 ?3 W( F) @* [
zdbbkgbddh26405195340.png

6 |+ e2 p1 j' Z+ B/ C3 o& `, |5 H小编测试环境:Mac m1、MATLAB22b参考资料:
5 X8 e& w ?' n9 `: W2 B7 g【1】颜色提取工具:https://c.runoob.com/front-end/6214/#d1e54e【2】https://www.mathworks.com/help/releases/R2021b/matlab/ref/bar.html【3】https://www.mathworks.com/help/releases/R2021b/matlab/ref/barh.html【4】https://mp.weixin.qq.com/s/isdAfipwwZeIjd-3wWS0Cw7 X- J6 H7 E c+ G) H+ w
- a4 w' x# y/ B: g6 w7 ^
扫一扫加QQ群3 L; m/ n4 a* l0 p9 T' t
fhqay55o4uv6405195440.jpg

. W j5 \) h. f. \扫一扫加管理员微信
: n6 U3 }- n" Z8 R
gckox51mvm26405195540.png
 ! ^$ @4 j* b8 M* _
euhy50jtihv6405195640.jpg

|
|