点击上方蓝字和“好玩的MATLAB”一起快乐玩耍吧!
qqnp3e0mgmb64099003920.jpg
好玩的matlab
带你解锁不一样的matlab新玩法
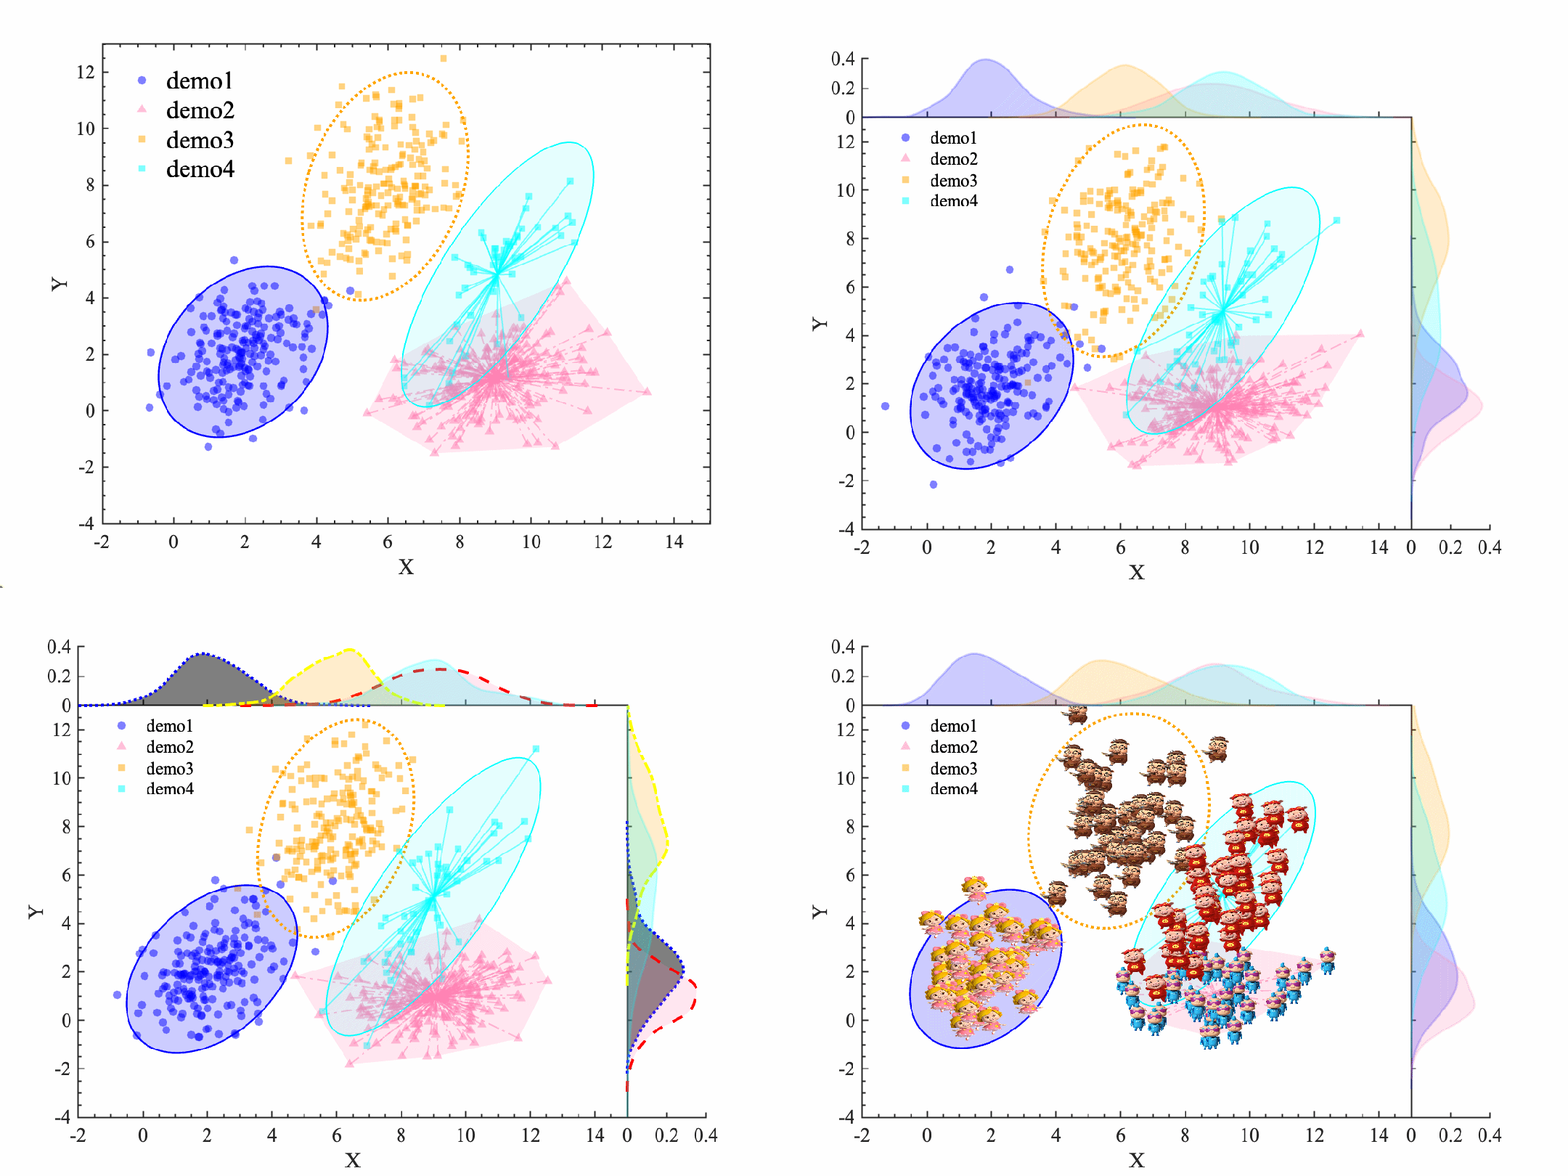
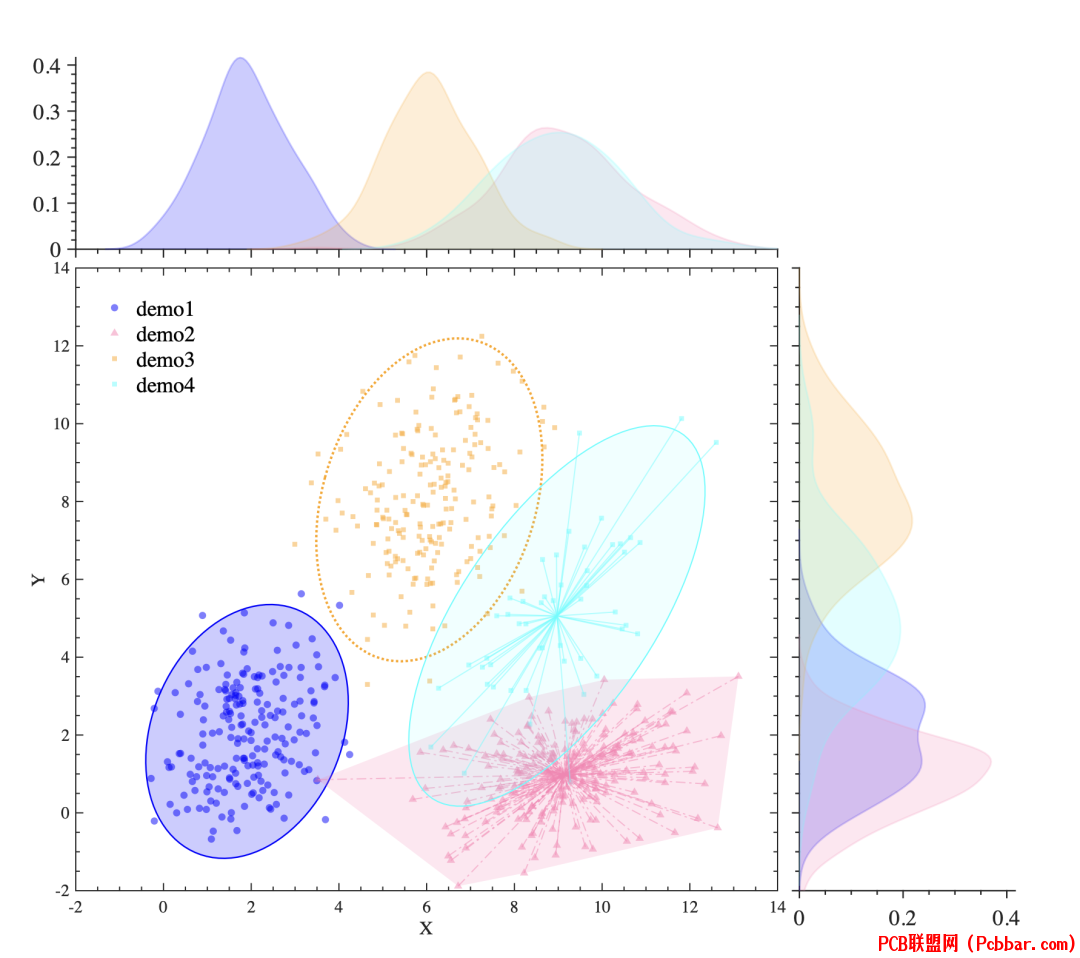
前几天介绍了Matlab绘制炫酷的聚类散点图,今天介绍一下聚类散点图添加边际图的核密度填充图,喜欢此推文的小伙伴们记得点赞+关注+分享!【尊重作者劳动成果,转载请注明推文链接和公众号名】
pmuc0zss3lv64099004020.png

效果图
x1nuvg0rmu464099004121.gif
uszhs0mo1xq64099004221.png
先运行之前推文的炫酷的聚类散点图的代码。clc;clear;close all;%--------------------------------------------------------------------------% @Author: 好玩的Matlab% @公众号:好玩的Matlab% @Created: 09,02,2023% @Email:2377389590@qq.com% @Disclaimer: This code is provided as-is without any warranty.%--------------------------------------------------------------------------
d1=repmat([2 2],200,1) + randn(200,2)*[1 .5; 0 1.32];d2=repmat([9 1],200,1) + randn(200,2)*[1.4 0.2; 0 0.98];d3=repmat([6 8],200,1) + randn(200,2)*[1 0.5; 0 1.7];d4=repmat([9 5],50,1) + randn(50,2)*[1 0.7; 0.5 2];% 使用scatter函数绘制散点图hold onsh1=scatter(d1(:,1), d1(:,2),'filled','CData',[0,0,1],'MarkerFaceAlpha',0.5,'MarkerEdgeColor','none','Marker','o');sh2=scatter(d2(:,1), d2(:,2),'filled','CData',[1, 0.5, 0.7],'MarkerFaceAlpha',0.5,'MarkerEdgeColor','none','Marker','^');sh3=scatter(d3(:,1), d3(:,2),'filled','CData',[1,0.6471,0],'MarkerFaceAlpha',0.5,'MarkerEdgeColor','none','Marker','s');sh4=scatter(d4(:,1), d4(:,2),'filled','CData',[0,1,1],'MarkerFaceAlpha',0.5,'MarkerEdgeColor','none','Marker','s');
confidenceLevel=0.95;ell1 = ConfidenceEllipse(sh1,d1, confidenceLevel);ell1.PlotType = 'fill';ell1.plotEllipse();
viz2 = ClusterViz(sh2, d2);viz2.PlotType='fill';viz2.clusterViz();
ell3 = ConfidenceEllipse(sh3,d3, confidenceLevel);ell3.PlotType = 'line';ell3.LineStyle=':';ell3.LineWidth=2;ell3.FillAlpha=1;ell3.plotEllipse();
ell4 = ConfidenceEllipse(sh4,d4, confidenceLevel);ell4.PlotType = 'fill';ell4.LineStyle='-';ell4.LineWidth=1;ell4.FillAlpha=0.1;ell4.plotEllipse();
viz4 = ClusterViz(sh4, d4);viz4.PlotTypeState='off';viz4.Color=[0,1,1];viz4.LineStyle='-';viz4.clusterViz();legend('demo1','demo2','demo3','demo4','box','off','Location','best','fontsize',18)% 设置轴标签和标题defaultAxes
kogcdpec4ce64099004321.png
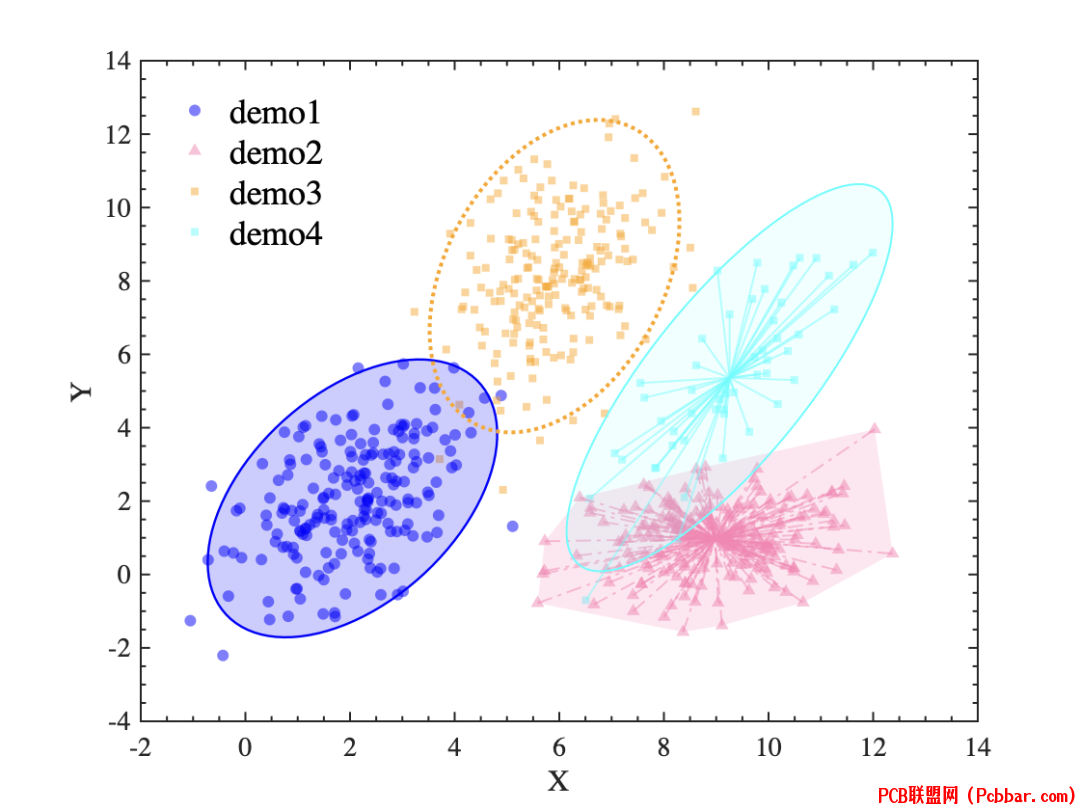
其中defaultAxes是修饰Axes属性的,因为经常重复调用,我写成了函数方便调用。
function defaultAxesax=gca;box on% ax.XLim=[-2,15];% ax.YLim=[-4,13];ax.XLabel.String='X';ax.YLabel.String='Y';ax.Title.String='';ax.FontName='Times New Roman';
ax.GridLineStyle = '-.'; % 设置网格线样式为虚线ax.GridColor = 'k'; % 设置网格线颜色为红色ax.XGrid = 'off'; % 关闭X轴网格线ax.YGrid = 'off'; % 打开Y轴网格线
ax.LineWidth = 1; % 设置坐标轴线宽ax.XMinorTick = 'on'; % 打开x轴次要刻度线ax.YMinorTick = 'on'; % 打开y轴次要刻度线ax.TickDir = 'in'; % 设置刻度线方向向外ax.FontSize = 14; % 设置坐标轴字体大小end其中PlotDensFill绘制边际图的核密度图代码如下。
classdef PlotDensFill %-------------------------------------------------------------------------- % @Author: 好玩的Matlab % @公众号:好玩的Matlab % @Created: 09,02,2023 % @Email:2377389590@qq.com % @Disclaimer: This code is provided as-is without any warranty. %--------------------------------------------------------------------------
properties XData; %x数据 YData; %y数据 FillColor %填充颜色 LineColor %线条颜色 FaceAlpha %透明度数 LineStyle %线条样式 LineWidth %线条宽度 LineMarker %标记符号 HFig end methods function obj = PlotDensFill(sHdl) % 设置默认参数 obj.XData=get(sHdl,'XData'); obj.YData=get(sHdl,'YData'); obj.FillColor=get(sHdl,'CData'); obj.FaceAlpha = get(sHdl,'MarkerFaceAlpha')*0.4; obj.LineColor = get(sHdl,'CData'); obj.LineStyle='-'; obj.LineWidth=1.5; obj.LineMarker='none'; obj.HFig=gcf; end
function plotDensFill(obj) hFig = obj.HFig; % 获取当前figure的句柄 axesPositions ={[0.07,0.07,0.65,0.65],... % 主图 [0.07,0.07,0.65,0.65],... % 与主图重合 [0.07,0.74,0.65,0.2],... % 顶部区域 [0.74,0.07,0.2,0.65]}; % 右侧区域
axObj=findall(hFig, 'Type', 'axes'); hFig.Position=[439 76 891 790]; axesCount = length(axObj); % axesCount = length(findall(gcf, 'Type', 'axes')); if axesCount==1 ax=gca; ax.Box='on'; ax.Position=axesPositions{1}; topAxes = axes('position', axesPositions{3}); rightAxes = axes('position', axesPositions{4}); end % 遍历所有 Axes 对象 for i = 1:length(axObj) ax = axObj(i); % 获取当前 Axes 对象 pos = get(ax, 'Position'); % 获取当前 Axes 对象的 Position 属性 % 检查 Position 是否匹配 if sum(abs(pos- axesPositions{1})) mainAxes=ax; elseif sum(abs(pos- axesPositions{3})) topAxes = ax; elseif sum(abs(pos- axesPositions{4})) rightAxes = ax; end end %核密度计算 [fx,xi] = ksdensity(obj.XData); [fy,yi] = ksdensity(obj.YData); % 这里绘制到topAxes if ~isempty(topAxes) axes(topAxes); hold on; %上图核密度曲线 fill(topAxes, [0,xi,fliplr(xi),0], [0,fx, zeros(1,length(fx)), 0],obj.FillColor, 'FaceAlpha', obj.FaceAlpha,'EdgeColor','none'); topAxes.YDir='normal'; topAxes.XMinorTick = 'on'; topAxes.YMinorTick = 'on'; topAxes.TickDir = 'out'; topAxes.TickLength=[.011 .01]; topAxes.XTickLabel={}; topAxes.Visible='on'; topAxes.Box='off'; topAxes.LineWidth=1.2; topAxes.FontSize=18; topAxes.FontName='Times New Roman'; topAxes.XLim=ax.XLim; topAxes.Box='off'; line(topAxes,xi,fx,'color',[obj.LineColor,obj.FaceAlpha],'LineStyle',obj.LineStyle,'Linewidth',obj.LineWidth,'Marker',obj.LineMarker); text(topAxes,topAxes.XLim(2) + abs(topAxes.XLim(2) - topAxes.XLim(1)) * 0.05, mean(topAxes.XLim), 'Top-Label', 'HorizontalAlignment', 'center',... 'VerticalAlignment', 'middle', 'Rotation', 90,'FontSize',18);
end % 这里绘制到rightAxes if ~isempty(rightAxes) axes(rightAxes); hold on; %右边图核密度曲线 fill(rightAxes,[0, fy, zeros(1,length(fy)), 0], [0, yi, fliplr(yi), 0], obj.FillColor, 'FaceAlpha',obj.FaceAlpha,'EdgeColor','none'); rightAxes.YDir='normal'; rightAxes.XMinorTick = 'on'; rightAxes.YMinorTick = 'on'; rightAxes.TickDir = 'out'; rightAxes.TickLength=[.011 .01]; rightAxes.YTickLabel={}; rightAxes.Visible='on'; rightAxes.Box='off'; rightAxes.LineWidth=1.2; rightAxes.FontSize=18; rightAxes.FontName='Times New Roman'; rightAxes.XLim=topAxes.YLim; rightAxes.YLim=ax.YLim; rightAxes.Box='off'; line(rightAxes,fy,yi,'color',[obj.LineColor,obj.FaceAlpha],'LineStyle',obj.LineStyle,'Linewidth',obj.LineWidth,'Marker',obj.LineMarker);
end % 绑定X Y linkaxes([mainAxes,rightAxes],'y') linkaxes([mainAxes,topAxes],'x') end
endend其中参数为:
XData x数据 YData y数据 FillColor 填充颜色 LineColor 线条颜色 FaceAlpha 透明度数 LineStyle 线条样式 LineWidth 线条宽度 LineMarker 标记符号
调用方式如下
然后运行关于PlotDensFill绘制边际图的核密度图代码。disp('按回车键继续运行代码')pausePhdl1=PlotDensFill(sh1);%设置填充的颜色和透明色% Phdl1.FillColor='k';% Phdl1.FaceAlpha=0.5;% % 设置线条的 格式,颜色,粗细% Phdl1.LineStyle=':';% Phdl1.LineColor='b';% Phdl1.LineWidth=2;% Phdl1.LineMarker='none';Phdl1.plotDensFill();
Phdl2=PlotDensFill(sh2);% Phdl2.LineStyle='--';% Phdl2.LineColor='r';% Phdl2.LineWidth=2;% Phdl2.LineMarker='none';Phdl2.plotDensFill();
Phdl3=PlotDensFill(sh3);% Phdl3.LineStyle='-.';% Phdl3.LineColor='y';% Phdl3.LineWidth=2;% Phdl3.LineMarker='none';Phdl3.plotDensFill();
Phdl4=PlotDensFill(sh4);Phdl4.plotDensFill();disp('运行结束')
degd5wxejdv64099004421.png
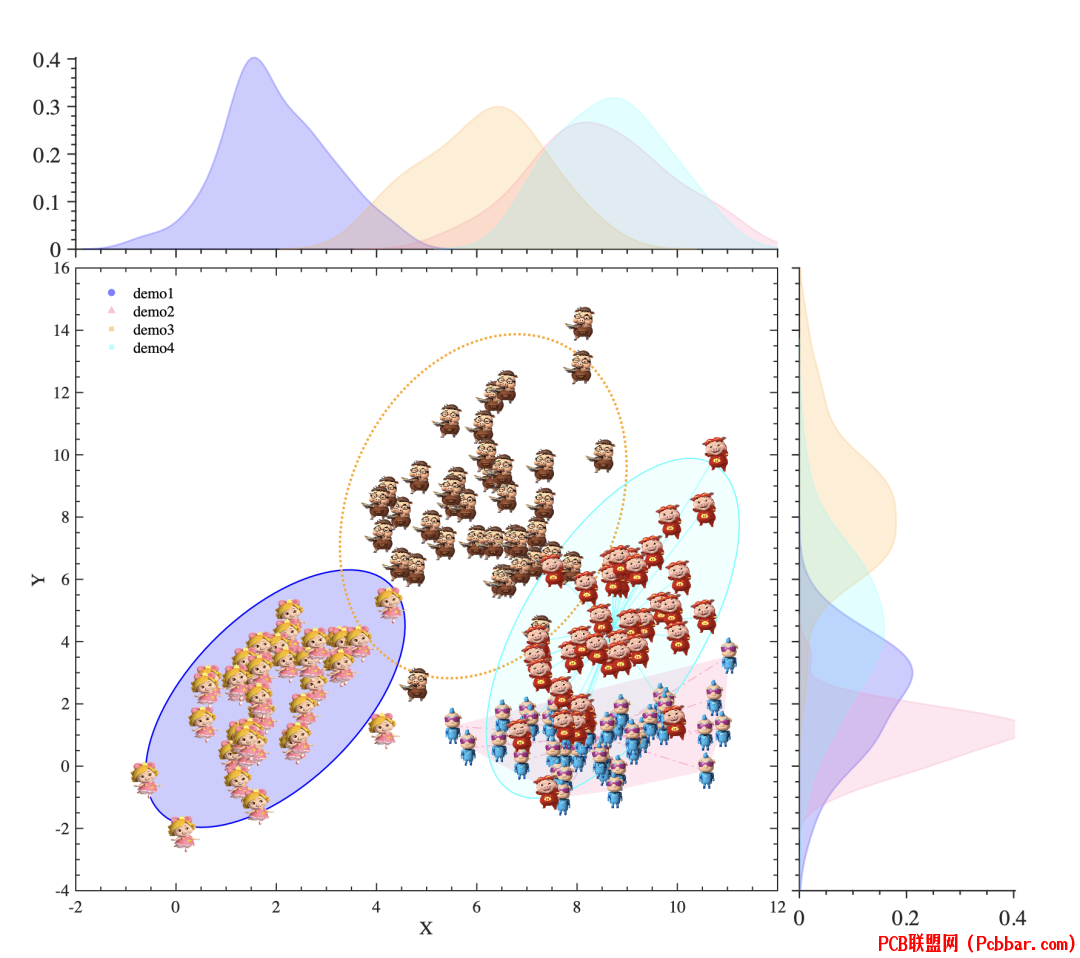
图片散点图添加边际图
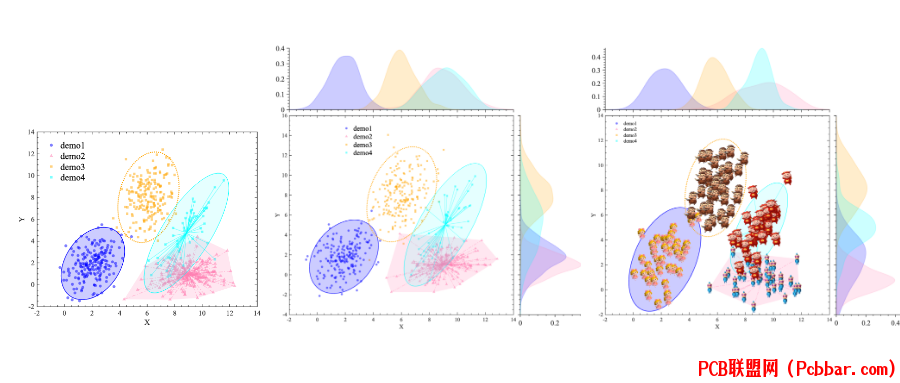
之前的图片散点图也可以添加边际图
clc;clear;close all;%--------------------------------------------------------------------------% @Author: 好玩的Matlab% @公众号:好玩的Matlab% @Created: 09,02,2023% @Email:2377389590@qq.com% @Disclaimer: This code is provided as-is without any warranty.%--------------------------------------------------------------------------
d1=repmat([2 2],40,1) + randn(40,2)*[1 .5; 0 1.32];d2=repmat([9 1],40,1) + randn(40,2)*[1.4 0.2; 0 0.98];d3=repmat([6 8],40,1) + randn(40,2)*[1 0.5; 0 1.7];d4=repmat([9 5],40,1) + randn(40,2)*[1 0.7; 0.5 2];% 使用scatter函数绘制散点图hold onsh1=scatter(d1(:,1), d1(:,2),'filled','CData',[0,0,1],'MarkerFaceAlpha',0.5,'MarkerEdgeColor','none','Marker','o');sh2=scatter(d2(:,1), d2(:,2),'filled','CData',[1, 0.5, 0.7],'MarkerFaceAlpha',0.5,'MarkerEdgeColor','none','Marker','^');sh3=scatter(d3(:,1), d3(:,2),'filled','CData',[1,0.6471,0],'MarkerFaceAlpha',0.5,'MarkerEdgeColor','none','Marker','s');sh4=scatter(d4(:,1), d4(:,2),'filled','CData',[0,1,1],'MarkerFaceAlpha',0.5,'MarkerEdgeColor','none','Marker','s');% 设置置信区间confidenceLevel=0.95;ell1 = ConfidenceEllipse(sh1,d1, confidenceLevel);ell1.PlotType = 'fill';ell1.plotEllipse();viz1 = ClusterViz(sh1, d1);viz1.PlotTypeState='on';
viz2 = ClusterViz(sh2, d2);viz2.PlotType='fill';viz2.clusterViz();
ell3 = ConfidenceEllipse(sh3,d3, confidenceLevel);ell3.PlotType = 'line';ell3.LineStyle=':';ell3.LineWidth=2;ell3.FillAlpha=1;ell3.plotEllipse();
ell4 = ConfidenceEllipse(sh4,d4, confidenceLevel);ell4.PlotType = 'fill';ell4.LineStyle='-';ell4.LineWidth=1;ell4.FillAlpha=0.1;ell4.plotEllipse();
viz4 = ClusterViz(sh4, d4);viz4.PlotTypeState='off';viz4.Color=[0,1,1];viz4.LineStyle='-';viz4.clusterViz();
coef=ones(1,length(d1))*3;plotImageScatter(d1(:,1), d1(:,2), 'pic/猪猪侠/2.png', coef); % 调用函数来绘制图像散点图plotImageScatter(d2(:,1),d2(:,2), 'pic/猪猪侠/3.png', coef); % 调用函数来绘制图像散点图plotImageScatter(d3(:,1),d3(:,2), 'pic/猪猪侠/4.png', coef); % 调用函数来绘制图像散点图plotImageScatter(d4(:,1),d4(:,2), 'pic/猪猪侠/5.png', coef); % 调用函数来绘制图像散点图
legend('demo1','demo2','demo3','demo4','box','off','Location','best')% 设置轴标签和标题defaultAxes
disp('按回车键继续运行代码')pause
Phdl1=PlotDensFill(sh1);%设置填充的颜色和透明色% Phdl1.FillColor='k';% Phdl1.FaceAlpha=0.5;% 设置线条的 格式,颜色,粗细% Phdl1.LineStyle=':';% Phdl1.LineColor='b';% Phdl1.LineWidth=2;% Phdl1.LineMarker='none';Phdl1.plotDensFill();
Phdl2=PlotDensFill(sh2);% Phdl2.LineStyle='--';% Phdl2.LineColor='r';% Phdl2.LineWidth=2;% Phdl2.LineMarker='none';Phdl2.plotDensFill();
Phdl3=PlotDensFill(sh3);% Phdl3.LineStyle='-.';% Phdl3.LineColor='y';% Phdl3.LineWidth=2;% Phdl3.LineMarker='none';Phdl3.plotDensFill();
Phdl4=PlotDensFill(sh4);Phdl4.plotDensFill();disp('运行结束')
jlnrl5rjrkv64099004522.png
- -THE END- -
源码下载:gitee下载:https://gitee.com/iDMatlab/PlotDensFill
mxzagcr5zhn64099004622.png

参考资料:
【1】MATLAB|炫酷的聚类散点图【2】MATLAB|怎么将散点图替换成图片【3】https://www.mathworks.com/help/releases/R2021b/matlab/ref/fill.html【4】https://www.mathworks.com/help/releases/R2021b/matlab/ref/scatter.html
2lsccd0s2xw64099004722.gif

phfbidqk22r64099004822.png

送书活动
mzwnobcrryk64099004922.png

ikmy5mpnfmy64099005022.gif

包邮赠送 「北京大学出版社」赞助《AI时代程序员开发之道:ChatGPT让程序员插上翅膀》
本书AI时代程序员开发之道:知识精进+重点解析+上机实训+综合实战+ChatGPT应用,零基础入门,让程序员插上翅膀高效开发!了解更多
▼▼▼
jfeg0pewayp64099005123.jpg

【抽奖方式及满足条件】:
1.关注「好玩的MATLAB 」公众号和视频号
nadxy4udujg64099005223.jpg

2.给本文点【赞】+【在看】;
3.留言区评论点赞最多的前3名。
4.本活动只针对从未获过奖的同学,之前获过奖的小伙伴,不用参加。
同时满足上述4个条件的读者朋友,包邮赠送一本:《AI时代程序员开发之道:ChatGPT让程序员插上翅膀》
【开奖时间】:2023年9月5日夜晚8点
【领奖方式】:在开奖时加小编私人微信:idmatlab
扫一扫加管理员微信
r2sjje2blt564099005323.png

hiyq2cmzg5o64099005423.jpg

|